Unit 1 - Functions: Characteristics and Properties
1.5 - Inverse Relations
Finding The Inverse
Algebraically
Given the equation for f(x), replace the x
with y and isolate for y.

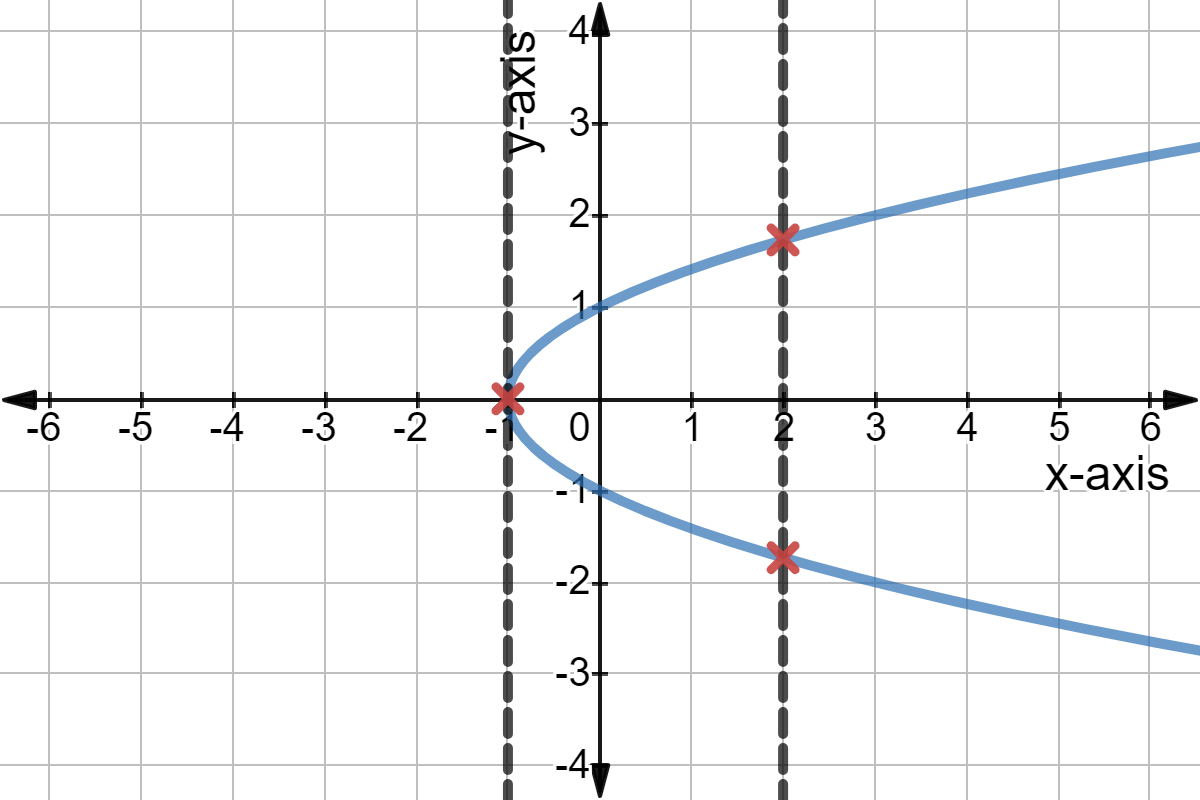
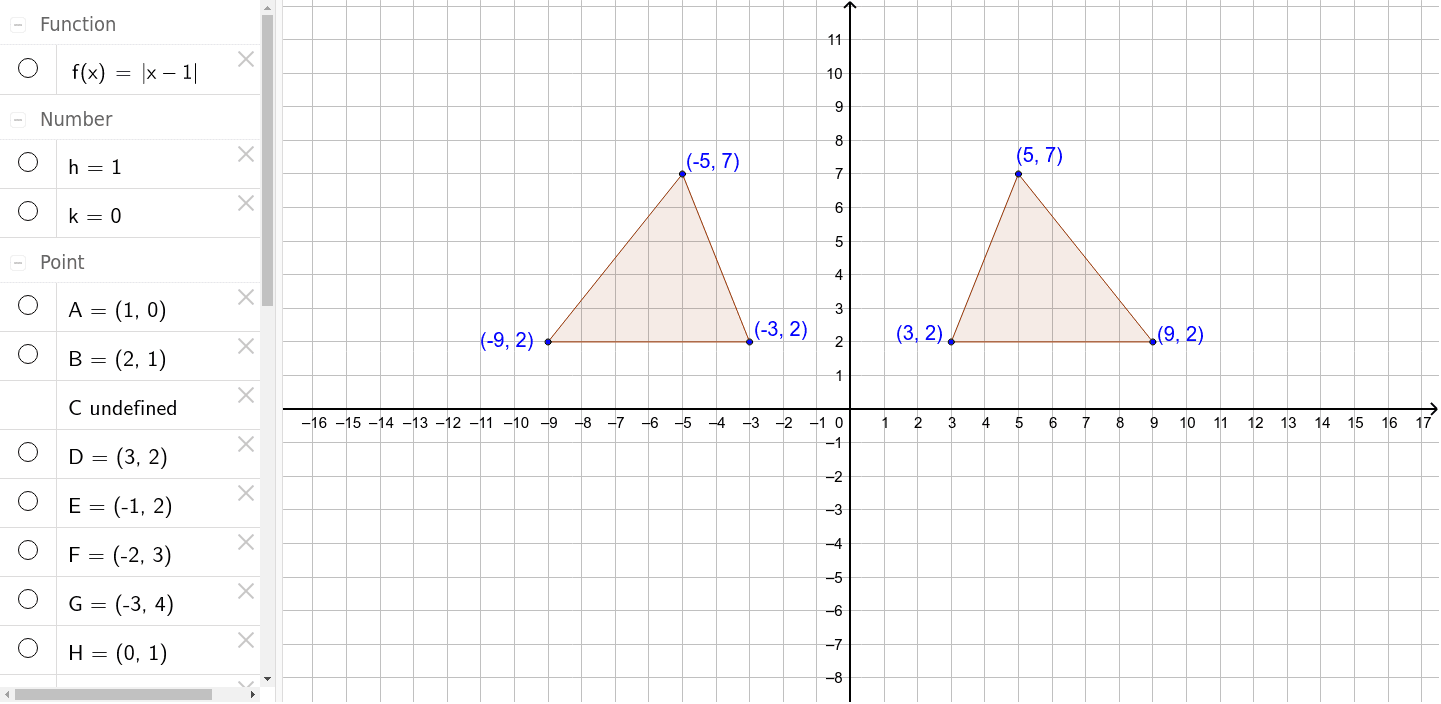
Graphically
Interchange the values for x and y.
(a, b) on the f(x) graph will be (b, a)
on the graph of f^-1(x).
Inverse Functions
Inverse Function
A function (that passes the vertical line test)
that is a reflection of y - f(x) in the line of y - x
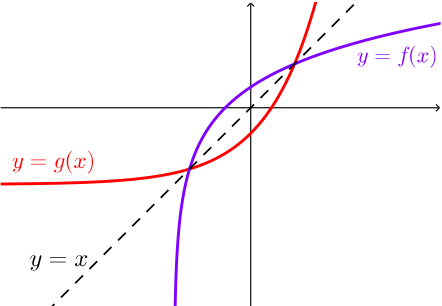
Self-Inverse Function
When the inverse of the function is the
same as the original function.
The function is symmetrical about the line of y - x
Domain & Range
Domain of the original function will be
the range of the inverse function.
The range of the original function will be the
domain of the inverse function.
1.6 - Piecewise Functions
Piecewise functions are functions that are represented by two or more components, or "pieces". The separate component of a piecewise function is defined for a specific interval in the domain of a function
When a piecewise function is graphed, it be a continuous graph or a discontinuous graph.
The Domain of piecewise functions can vary.
- If it is continuous, it has a domain of all real number.
- If discontinuous, there is a break in the graph and there are a few restrictions on the domain.
To Graph:
1. Draw each of the graphs given in your equation
2. Make small lines on the places you have to "cut" each
of the three graphs. At this time, also figure out if the graphs given is closed circle or open circle. This can give you an idea on if the graph is going to be continuous or not.
3. Assemble all the graphs together!
To Determine Algebraic Representation:
1. Determine the closed circles and open circles
2. Figure out what parent function the component is
3. Solve.
1.7 - Exploring Operations with Functions
Domain
If two functions have the same domain,
they can be added or multiplied to get a
new function on that shared domain.
To solve graphically:
If given a graph, only the y values
are being manipulated. The y values
are only manipulated when the y values share
the same domain. If the domain is the same,
then you can add/subtract/multiply.
To solve algebraically:
If given the equations, preferably two equations
in the form of f(x) and in the form of g(x), you can
do whatever operation (except division) that the question is stating to do.
You can add/subtract.multiply the expressions and then simplify

Given coordinates:
If given a set of coordinates. You only
look at the sets of coordinates in both f(x) and g(x)
to see if both of the share any of the same x values.
If they do, simply proceed to add/subtract/multiply only
the ones that share the same domain.

1.8 - Composite Functions
Two or more functions combined
results in what is called a
"Composite Function"
fog (x)
f(g(x))
this notation is slightly more usable than the other one
because it allows you to see that you will first work inside of the function
To solve: given both f(x) and g(x), find what the question is
asking and then later simplify your answers.

1.1 - Relations & Functions
Relations
a set of ordered pairs in which an x value is paired with a
y value.
Functions
relation/set of ordered pairs in which for every balie for x, there is only one definite value for y. y cannot be shared by two x values, it only has to be shared by 1.
x-y notation

function notation
tool that is used to represent the value of (Y) for a given value of x .

How to Solve:
Through Ordered sets:
Function
the arrows from the domain all point to one y, meaning
that for all the x values there is one definite y value.
Not a Function
the arrows from 1 in the domain is pointing
to more than 1 y value, meaning that this is not a function
since x doesn't have a definite y
Vertical Line Test on a Graph
If it passes the vertical line test, than one line drawn
vertically through the graph should only be touching that one line.

If it passes through it twice, then the graph is not a functoin
1.2 - Exploring Absolute Values
Absolute Value
f(x) = l x l
If you want to seek the absolute value of a number,
whether positive or negative, it is always going to be a
positive number (with a few exceptions). When you evaluate,
it is possible to be involved with operations.
It is a distance, not a direction. This is the reason why
it cannot be negative.
Absolute Value & Inequalities
a > 0 ; a is positive
all the points that are less than a but greater
than - a is included in this number line
l x l < a ; then - a < x < a
open circles are used when it comes
to the number line since the point is not
a part of the solution

if l x l ≤ a, then -a ≤ x ≤ a
closed circles are used when it comes to
this number line since the point is a part of
the solution

Brackets
(-3, 3)
all the points that are less than a
and are greater than - a is included in this number line
if l x l > a, then -a < x > a
open circles are used when it comes
to the number line since the point is not
a part of the solution

if l x l ≥ a, then - a ≤ x ≥ a
closed circles are used when it comes to
this number line since the point is a part of
the solution

Brackets
if l x l > a, then -a < x > a
( -∞, -a]
if l x l ≥ a, then - a ≤ x ≥ a
[2, ∞)
1.3 - Sketching Graphs of Functions
Domain & Range
Domain & Range
Domain
set of all possible
x-values of an
equation given
Range
set of all possible
y-values of an
equation given
Restrictions
Rather than state all the numbers that
are possible for the domain and range,
the symbol R is used to classify all real
are included, and afterwards state the
numbers that are not possible afterwards.
These are called restrictions
Subtopic
Transformations
y = + or -af[k(x+ or - d)] + or - c
must be performed in a particular order:
01. horizontal/vertical stretches/compressions
02. reflections
03. horizontal/vertical translations (shifts
In y = f(-x), there is reflection in the y axis
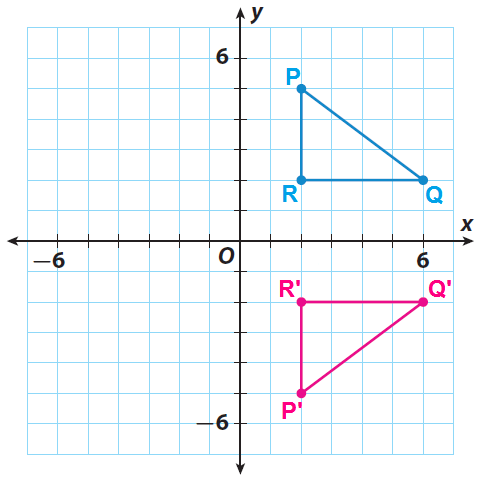
In y = -f(x), there is a reflection in the x axis
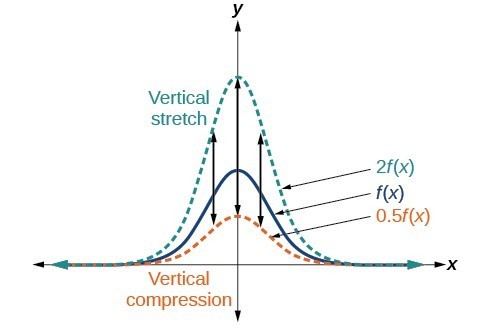
In y = af(x), there is a vertical stretch or compression by a units
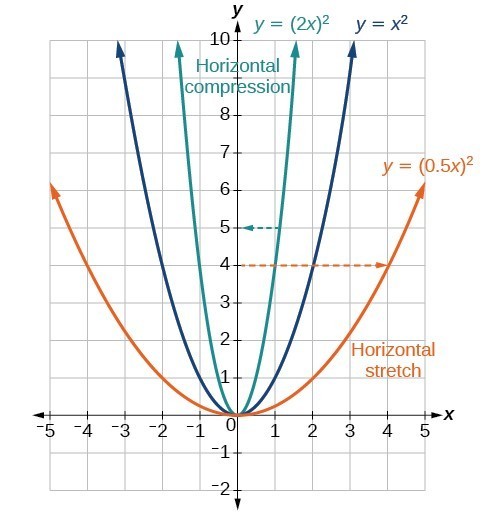
In y = f(kx), there is a horizontal stretch or compression by k units
In fy = (x) + or - c. a vertical translation by c units
In f(x+ or - d), there is a horizontal translation by d units

1.4 - Properties of Graphs of Functions (GC)
Intervals
Intervals of Increase/Decrease can be applied
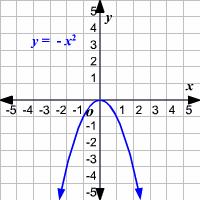
to any parent function given. This example will be showcased on a parabola
Intervals Of Increase
To say a function is increasing on
an interval, the y-value increases while the x-value
is increasing as well.
In the example given:
The intervals of increase here are
(- 8, ∞)
Intervals of Decrease
To say a function is decreasing, the y-value is
decreasing while the x-value increases.
In the example given:
The intervals of decrease are (-∞, -8)
Symmetry
Even Functions
Graphing Even Functions
"symmetric about the y-axis"
- whatever the graph is doing
on one side of the y-axis is reflected
on the other side of the y-axis
Algebraically:
f(-x) = f(x)

Odd Functions
Graphing Odd Functions
"symmetric about the origin"
- half of the graph on one side
of the y-axis is upside down compared
to the other half of the graph on the
other side of the y-axis.
Algebraically:
f(-x) = -f(x)

Neither Odd or Even
in order to make sure if the
function given is neither odd
nor even, you have to input both
the even function and the off function.

Subtopic
Continuous & Discontinuous Functions
Continuous Function
a function that does not contain any breaks
or holes over its entire domain/x values.
Discontinuous Function
a function that has holes, vertical asymptotes,
or any jumps present in the function
The break in the graph is called an asymptote
or a point of discontinuity

End Behaviours
Behaviour of a f(x) graph, when x either approach positive infinity or negative infinity.
The degree and leading coefficient determine the end behaviour of a graph.
Positive End Behaviour;
where it is approaching positive infinity
Negative End Behaviour:
where it is approaching negative infinity
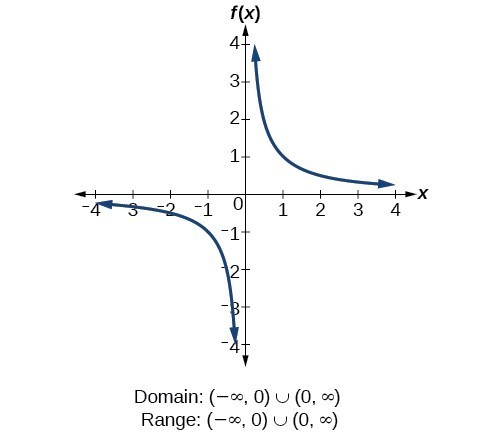
Asymptotes
An asymptote is an "imaginary" line that gets closer and closer
to but will never cross on some part of its domain
Domain for f(x) = 1/f(x): { xer / x cannot equal 0}
Graphical Characteristics
A function can be categorized from its graphical characteristics. Given a set, the type of functions that has certain graphical characteristics can be determined and be eliminated from the rest
Domain And Range
Symmetry (Even/Odd)
Turning Point
Intervals of Increae/Decreae
Continuity/Discontinuity
X and Y Intercepts
Turning Points
A point on a graphical curve where the function
changes from an increase to decrease or vice versa; which is from decrease to an increase