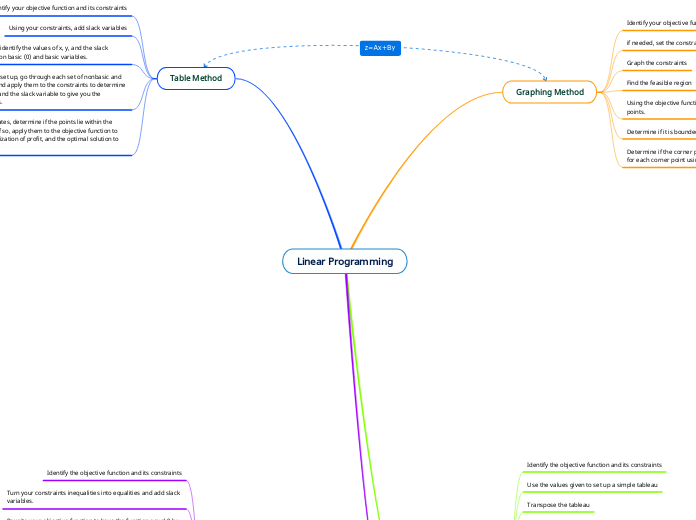
Identify your objective function and its constraints
if needed, set the constraints to find y
Graph the constraints
Find the feasible region
Using the objective function and its constraints, find the corner points.
Determine if it is bounded or unbounded
Determine if the corner points are feasible and the value of z for each corner point using the objective function
Identify the objective function and its constraints
Use the values given to set up a simple tableau
Transpose the tableau
Rewrite the inequalities
Turn the inequalities into equalities and add slack variables
Rewrite your objective function to have the function equal 0 by transitioning your values to the side of P, turning them negative. (-8x -9x +P=0)
Find the biggest negative from the newly rewritten objective function (Bottom Row)
Determine pivot column
Next, find the pivot row by dividing the values of the constraints by their answer of their solution. The smallest quotient will indicate the pivot row and the pivot element.
The pivot element needs to equal 1, and the numbers above and below must equal 0. Multiply the entire row by the appropriate amount to turn the pivot element to equal 1
Next, multiply the pivot row by the appropriate negative to make the values of the numbers above and below the pivot element to equal 0 through addition
Repeat these steps as necessary until there are no more negatives in the rewritten objective function.
Now it time to determine the value of x's, p, and slack variables. For minimization, the values will be on the bottom row. 1's indicate the correct variable and 0's and any other numbers will indicate that the variable 0. With this, you can determine the optimal variables to find the minimization of cost.
Identify your objective function and its constraints
Using your constraints, add slack variables
Create a table to identify the values of x, y, and the slack variables using non basic (0) and basic variables.
Once the table is set up, go through each set of nonbasic and basic variables and apply them to the constraints to determine the value of x, y, and the slack variable to give you the coordinate points.
With the coordinates, determine if the points lie within the feasible region. If so, apply them to the objective function to find z, the maximization of profit, and the optimal solution to minimize cost.
Maximization
Identify the objective function and its constraints
Turn your constraints inequalities into equalities and add slack variables.
Rewrite your objective function to have the function equal 0 by transitioning your values to the side of P, turning them negative. (-8x -9x +P=0)
With your new equalities, use the value to set up a simplex tableau
Find the biggest negative from the newly rewritten objective function (Bottom Row)
Determine pivot column
Next, find the pivot row by dividing the values of the constraints by their answer of their solution. The smallest quotient will indicate the pivot row and the pivot element.
The pivot element needs to equal 1, and the numbers above and below must equal 0. Multiply the entire row by the appropriate amount to turn the pivot element to equal 1
Next, multiply the pivot row by the appropriate negative to make the values of the numbers above and below the pivot element to equal 0 through addition
Repeat these steps as necessary until there are no more negatives in the rewritten objective function.
Now it's time to determine the values of your x's, y's, P, and slack variables. In your constraints, where there are 1's, the solutions to your constraints (Furthest right values) are indicated. If there is a zero or any other number, the values will be zero. With this, you can determine the optimal values for the maximization of profit.