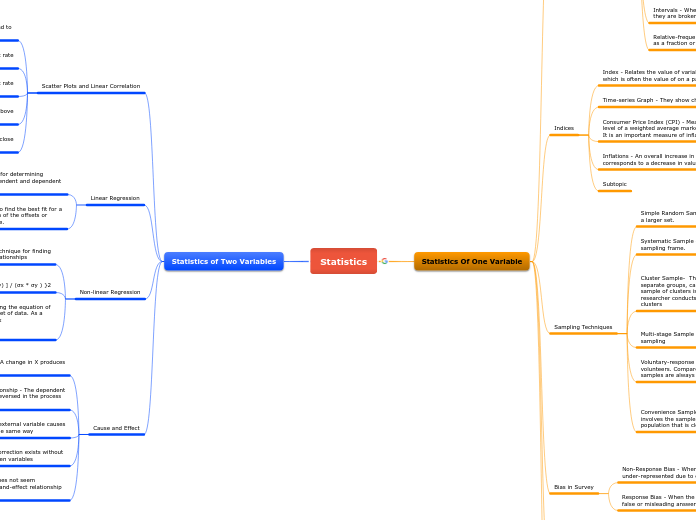
Statistics
Statistics Of One Variable
Data Analysis With Graph
Raw Data - The crude informations collected
from a qualitative analysis
Variable - The quota being calculated
range
Continuous variable - Any value within a given
Discrete variable - Is restricted to having certain
separate number, usually integers
Histogram - Bar graph at which bars are
proportional to the frequencies of the values
of the variable
Frequency polygon - Plot frequency vs. variable
and join the two lines. It shows the same information
as a histogram

Intervals - When the given values are large numbers,
they are broken in to classes or intervals
Relative-frequency - Shows the frequency data groups
as a fraction or precent of the whole data set
Indices
Index - Relates the value of variables to a base level,
which is often the value of on a particular date
Time-series Graph - They show changes over time
Consumer Price Index (CPI) - Measures changes in the price level of a weighted average market basket of consumer goods. It is an important measure of inflations
Inflations - An overall increase in pice, which
corresponds to a decrease in value of money
Subtopic
Sampling Techniques
Simple Random Sample - A subset of individuals chosen from a larger set.
Systematic Sample - Selection of elements from an ordered sampling frame.
Cluster Sample- The researcher divides the population into separate groups, called clusters. Then, a simple random sample of clusters is selected from the population. The researcher conducts his analysis on data from the sampled clusters

Multi-stage Sample - Use several levels of random
sampling
Voluntary-response Sampling - A sample made up of volunteers. Compared to a random sample, these types of samples are always biased
Convenience Sample - a type of non-probability sampling that involves the sample being drawn from that part of the population that is close to hand
Bias in Survey
Non-Response Bias - When a particular group is
under-represented due to choice
Response Bias - When the participants provide
false or misleading answers
Measure of Central Tendancy
Mean - Sum of the values of a variable divided by
the number of values
Median - The middle value of the data when they are ranked
from highest to lowest
Mode - Is the value that occurs most often in a distribution
Outliers - Values that are distant from the majority of the data
Measures of Spread
Dispersion - Set quantities that show how closely a set
data clusters around the center
Population Standard Deviation -
σ = sqrt[ Σ ( Xi – μ )2 / N ]
Population Variance -
σ2 = Σ ( Xi – μ )2 / N
Quantities And Interquartile Ranges
Interquartile Ranges - Q3 : Q1
Semi-interquartile Range - Is one half of the
Interquartile ranges
Statistics of Two Variables
Scatter Plots and Linear Correlation
Linear Correlation - Changes in one variable tend to
be proportional to changes in the other
Perfect Positive- If Y increases at a constant rate
as X increases
Perfect Negative - If Y decreases at a constant rate
as X increases
Scatter Plot - Shows the relations mentioned above
graphically
Line of Best Fit - A straight line that passes as close
as possible to all points on a scatter plot
Linear Regression
Regression- Analytic technique for determining
the relationship between independent and dependent
variables
Least-Square Fit - statistical procedure to find the best fit for a set of data points by minimizing the sum of the offsets or residuals of points from the plotted curve.
Non-linear Regression
Non-linear Regression - Analytic technique for finding
a curve of best fit for data from relationships
Coefficient of Determination -
R2 = { ( 1 / N ) * Σ [ (xi - x) * (yi - y) ] / (σx * σy ) }2
Exponential Regression - the process of finding the equation of the exponential function that fits best for a set of data. As a result, we get an equation of the form y=abx
y=ab^x where
a≠0
Cause and Effect
Cause-and-Effect Relationship - A change in X produces
a change in Y
Reverse Cause-and-Effect Relationship - The dependent
and independent variables are reversed in the process
of establishing causality
Common-Cause Factor - An external variable causes
two variables to change in the same way
Accidental Relationship - A correction exists without
any causal relationship between variables
Presumed Relationship - A correction does not seem
to be accidental even though no cause-and-effect relationship or common-cause factor is apparent