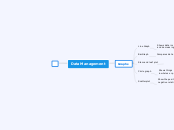
Data Management
Graphs
Line Graph
Shows data increasing
and decreasing
Bar Graph
Compares data
Stem and leaf plot
Stem and leaf plot is to show
many numbers in a little chart.
Circle graph
Shows things people like
in wholes or percentage
Scatterplot
Show the positive or
negative relationship
Data management is graphing data and then analyzing the it.
M,M,M,R
Mean
The mean is adding all the
numbers and than dividing
all the numbers.
Median
Median is when you order
all the numbers from least
to greatest and then find the
middle number.
Mode
Mode is the number that
occurs the most.
Range
Range is the numbers least to greatest
or the greatest number subtract the least.
