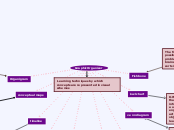
Learning techniques by which concepts are represented in visual schemes
Organigram
Organigram (sometimes organogram or organizational chart) is a graphical representation of the organizational structure of the enterprise or organization. Organigram shows clearly the entire organizational structure and interactions of individual organizational units, jobs or specific people in the organization, especially managers.
Fishbone
The fishbone diagram identifies many possible causes for an effect or problem. It can be used to structure a brainstorming session. It immediately sorts ideas into useful categories.
conceptual maps
are graphical tools for organizing and representing knowledge. They include concepts, usually enclosed in circles or boxes of some type, and relationships between concepts indicated by a connecting line linking two concepts
flow chart
A flowchart is a formalized graphic representation of a logic sequence, work or manufacturing process, organization chart, or similar formalized structure. The purpose of a flow chart is to provide people with a common language or reference point when dealing with a project or process.
timeline
A timeline is the presentation of a chronological sequence of events along a drawn line that enables a viewer to understand temporal relationships quickly. The term is also sometimes extended to mean a chronology that is tabular, year-by-year paragraphs or purely conceptual. Increasingly, timelines are illustrated in infographics combining text and graphic images for a better presentation
kwl chart
K-W-L charts are graphic organizers that help students organize information before, during, and after a unit or a lesson. They can be used to engage students in a new topic, activate prior knowledge, share unit objectives, and monitor students’ learning.
venn diagram
A Venn diagram is an illustration of the relationships between and among sets, groups of objects that share something in common. Usually, Venn diagrams are used to depict set intersections (denoted by an upside-down letter U). This type of diagram is used in scientific and engineering presentations, in theoretical mathematics, in computer applications, and in statistics.
spider map
Mind Maps
A mind map is an easy way to brainstorm thoughts organically without worrying about order and structure. It allows you to visually structure your ideas to help with analysis and recall.
brainstorm
Brainstorming is the name given to a situation when a group of people meet to generate new ideas around a specific area of interest. Using rules which remove inhibitions, people are able to think more freely and move into new areas of thought and so create numerous new ideas and solutions. The participants shout out ideas as they occur to them and then build on the ideas raised by others. All the ideas are noted down and are not criticized. Only when the brainstorming session is over are the ideas evaluated.
Spider mapping which is sometimes called Semantic map is a graphic organizer that can be used for brainstorming ideas, aspects, and thoughts of normally a single theme or topic. It gets its name because of the way it looks when drawn out. Typically done for writing stories, papers, and research brainstorming.