Statistics
Exploring relationships between data
Variables
Response variable
Value depends on explanatory variable
Plotted on the y axis
Explanatory variables
Explains the change in the variable and affects the value of the response variable
Plotted on the x axis
Scatterplot
Scatterplots ae used to study the relationship between 2 quantitative variables
The variables are plotted and the relationship is noted
Relationship
Negative
Smaller variables of one variable is associated with the smaller value of the other variable
Positive
Larger values of one variable is associated with the larger values of the other variable
Points to note
Direction
Overall direction of relationship
Strength
Strength of relationship
Outliers
Outliers must be noted
Correation
Denoted by r
Helps to measure the strength and direction of a relationship between 2 variables
If r > 0 relationship is positive and if r < 0 relationship is negative
If r is near 0 , might mean no relation ship or a strong non linear relationship , if r is close to 1 or -1 then the relationship is linear
-1≤r≤1
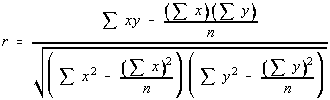
r is not a resistant measure
Regression Line
A line drawn through a scatter plot so that it is close to as many points as possible
Least Squares Regression Line
The line that minimizes the sum of the squre of the differences between the observed values and values predicted by the line
y= a + bx
Can be used to predict values
Residuals
Observed Y - Predicted Y
Sum of residuals is 0
Mean of redisuals is 0
Plot of residuals

Plot of residuals must have no pattern
If there is a pattern in the residual plot
It means that a non linear relationship would better explain the data
Coefficent of determination
Denoted by r^2
Gives the percentage of data that can be explained by the regression line
Cautions
Outliers
Shows up as a point with a very large residual
Lurking variables
May affect the relationship between variables without being aparent
Measures of Data
Measuring the Center
Mean

Sum of all the elements of a set divided by the number of elements
Can be affected by outliers
Median
The middle value of a data set once it has been arranged ascendingly or descendingly
Resistant to outliers
Meauring the Spread
Range
Interquartile Range
The difference between the largest and smallest value
IQR can be used to remove influence of extreme values
It is the middle 50% of the data ( i.e that the bottom and top 25% have been removed
Outliers
Values more than 1.5(IQR) below the 1st quartile of more than the 3rd quartile are outliers
Variance
Average of the squared deviations from the mean

Standard Deviation

Gives a measure of spread around the sample mean
Affected by outliers , use only mean is also used
n-1 is the degrees of freedom
Boxplots are very useful
Can give the IQR , Median and Outliers
Plotted to check for outliers usually
Modified boxplot is boxplot with outliers removed
Measuring the Position
Simple Ranking
Arranging the elements in some order and noting where in that order a particular value falls
Percentile Ranking
Rank of 80% means that 80% of all values fall below that point or on it
The value at which p% of values fall below or on that point
Quartile ranking in which the data is split into 4 equal quartiles of 25%
Z-Score
The number of standard deviations a values lies from the mean

Emperical Rule
a.ka 68-95-99.7 rule
68 % of data lies within 1 standard deviation of the mean
95% of the data lies within 2 standard deviations of the mean
99.7% of the data lies within 3 standard deviations of the mean
Usefull to estimate the standard deviation if we know the data

Analysis of Data
Quantitative Data
Histogram
A plot of the observation on the x axis and the frequency on the y axis
Suitable for large quantities of data
Easy to visualize data
Total count of data is given by the sum of frequencies

Cummilative frequency plot
Somewhat similar to a histogram
The relative frequency of the data is summed and plotted
Stemplot
Similar to a histogram but the frequency is represented by leafs on a stem
Good to spot normality
Sometimes the plot may get too big
Trim the stemplot
Split the stem into 2
Very important to indicate legend

Catergorical Data
Pie Charts
Each slice of the pie represents the proportion of a particular category
Very good for comparing the proportions of different categories
Bar Chart
Each bar represents a particular category
The height of the bar represents the amount of that category
Important to have the width the same
Dot Plots
Each catergory is plotted on one side and the frequency or value is indicated with dots on the other side of graph
Important to state the legend
Shapes of Graphs
Uniform Distribution
Uniform if the histogram of the distribution is a straight line
Example would be of a dice , the freq for all numbers is 1/6
Skewed graphs
Skewed right
Skewed right if spreads far and thinly towards the higher values
Skewed left
Skewed left is it spreads far and thinly towards the lower values
Symmetric Distribution
2 halves of the graphs are mirror images
Bell shaped curve
If the distribution is symmetric with 2 sloping tails
Describing Graphs
Center
The point that seperates the values(area of graph) roughly in half
Spread
Scope of values from smallest to lagest
Clusters
Natural subgroups that the values fall into
Gaps
Holes in distributions where no values fall in
Outliers
Extreme values of a graph
Usually determined by the 1.5IQR rule
Modes
Unimodal
Only has one peak
Bimodal / Multimodal
Has more than one peaks
Highest peaks in the grpahs
Sampling and Experimental study
Types of sampling
Bias
Bias is created when the results have a factor that has affected the outcome
Nonresponse
Occurs in convinience sampling usually , when the individaul does not respon to the survey
Small sample size
Small sample size would not give accurate resulkts
Undercoverage
Some people might have been left out in the sample
Different Sampling Types
Random Sampling
SRS ( Simple random sampling)
A random sample size is chosen from a population
Random table can be used to select
Stratifed Sampling
Population is split into different stratas before data is taken from each strata is taken
Usually split into diffeent strata based on common characteristic
Clusters
The population is split into clusters
A particular cluster is chosen and all those in it are included
Voluntary Sampling
Only results of those who respond is considered.
Biased as those who respond may share common trait
Convinience Sampling
Only those who approach the surveyor get sampled
Biased
Census
A census is when the data of the entire population is obtained
Experimental design
Observational Study
Done by observing the outcomes without influencing the enivronment
Experimental Study
Done by altering the environment and observing the results
Degin Types
Matched Pair
Subjects are paired
Each one is put through a different treatment group
Results are compared
Blocked
Subjects with similar conditions that may affect results are blocked
Randomised
Subjects are allocated at random
Blinding
Blinging is important as either party in the experiment knowing anything about the subjects might induce bias
Single blind
The subjects do not know what they are gettting
Double Blind
Both the subjects and the researchers do not know what they are getting
Placebo
Used when comparing 2 treatments, the placebo is a fasle treatement
Used to remove any phsycological bias
Steps to design
Suitable desgin type
Suitable treatments
All variables taken into account
Control
One group may receive the treatment while another control group may not receive any for control purposes
Replication
Experiment needs to be replicated to ensure consisten results
Also helps to remove error brought about by chance
Probability , Permutation and Combinations
Permutations
Different number of ways a set of objects can be arranged
take note that the order has to be distinct , order matters
n! gives number of ways for n objects to be arranged
(n-1)! gives the number of ways for n objects to be arranged in a circle
When choosing way to arrenge r objects from n
Combinations
Order is ignored
Only number of ways to get different items matters
Objects have to be distinct
Probability
Probability of event
P(x) = 1 means that the event will defenitely and always occur
P(x) = 0 means that the event would not occur
If A and B are disjoint
P(A U B) = P(A) + P(B)
P(A intersect B) = 0
Hypothesis testing
Hypothesis
Null hypo : Nothing is different
Alternative hypo : Different from null
Errors
Type 1 error
Rejecting the null hypothesis when it is true
Type 2 error
Fail to reject null hypothesis when it is not true
Power of test
To increase power
Increase alpha
More extreme alternative
Descrease std deviation
Increase sample size
80% power is used as standard
2 Population
2 Sample Z test
2 Sample T test
Confidence interval
Conservative approach for df
df = Min( n-1 , n02)
Conditions
SRS
Independence
Population size is at least 10(n)
Normality
At least 5 for each sample
n1+n2<15
Normal no outliers and no strong skew
15<n1+n2<30
No outliers and no skewedness must be present in the data
n1+n2>30
Can be used even if distribution is skewed
Hypothesis testing
Degrees of freedom
Conservative
The degrees of freedon of both the samples must be considered and the smaller one chosen
Close approximation
Population Proportion
2 population z-test for hypo. test
Combined sample proportion
Conditions
SRS
Data must be obtained from an srs
Independence
Population size is at least 10 times of sample
Normality
The count of success and failures is at least 5
2 population z-interval for confidence
Conditions
SRS
Data must be obtained from an srs
Independence
Population size is at least 10 times of sample
Normality
The count of success and failures is at least 5
1 Population
Test about population mean
Std deviation known
1 Population Z test
Alternate Hypothesis
Condition
SRS
Data must be obtained from an SRS
Independence
Population is at least 10 times bigger than sample
Normality
Sample size at least 30
Std deviation not known
1 Population T test
Conditions
SRS
Sample must be by SRS
Independence
Populaiton is at least 10 times bigger than sample
Normality
n < 15
Population must be normally distributed and there must be no outliers
n < 30
No outliers or strong skew must be present
n >30
T procedure can be applied even if there is skewedness present in the data
Test about population proportion
Hypothesis
Conditions
SRS
Data must be from an srs
Normality
np and nq must be greater than 10
Independence
Population is 10 times of sample size
Distribution
Chi Sqaure
Goodness of fit
Each expected cout must be more than 5
2 way table
Null hypothesis
The distribution in the response variable is the same in all x populations
Alternative hypothesis
The x distributions are all not the same
Chi Square distribution
Probability Density Function
Cummilative Distribution Function
Normal
Z score
Gives the number of std deviations the value is from the mean
Usually used for large sample sizes
Generally used for distributions where majority of the obervations cluser around mean
Clear link between mean and standard deviation
Central limit theorem
When the sample size is more than 30
Normality can be assumed
Does not work with proportions
Can be used to approximate binomial and poisson distribution
Bionomial
Conditions
There are only 2 outcomes in the trial, one defined as "Success" and the other as "Failure"
The number of trials n is fixed
The outcome of each trial is independent
Probability of succes for each trial is the same
X~B(n,p)
Mean = np
Std deviation = root(np(1-p))
Normal approximation
Can be approximated to normal distibution
Condition
np and np(1-p) greater than 10
Most accurate when p = 0.5
If p is not close to 0.5 , approximation would be poor
Continuity correction must be performed
Poisson
Conditions
Events occur singly and randomly
Events occur uniformly
Probability of even occuring is very low
Events occur independently
Po(x) + Po(y) = Po(x+y)
Normal approximation
X~ N(np)
np must be large > 50
More accurate if n is large and p very low
Geometric
Conditions
There are only 2 outcomes in the trial, one defined as "success" and the other as "Failure"
The number of trials n is not fixed
The outcome of each trial is independent
Probability of succes for each trial is the same
The variable of interest X is the number of trials before the first succes
mean is 1/p
Standard deviation is q/p^2
Sampling Distribution
Parameter and statistic
Parameter describes a property of a population such as mean
Statistic is usually computated from the sample of a proportion
Samling variablity
Value of statistics varies over many trials
A larger sample would produce lesser variablity
Sampling distribution
Overall shape should be roughly normal
Acceptable if it is skewed but must not have outliers
No outliers should be rpesent
Center of distribution should be close to mean of population
Bias
How far the mean of the sample is from the mean of the population
Sample proportion
Used when meauring the proportion of a population
Mean proportion of sample is equal to that of the population
Standard deviation
Sample mean
Mean of samle is mean of population
Std deviation