both grades yield identical results
taking value away
complicating
job losses in traditional sectors
increased unemployment rates
instability for families
perpetuating cycles of poverty.
challenges related to teacher recruitment
over 50 years old
not maintained or upgraded.
6% of Ohio’s 44,736 bridges
in poor condition
indicating failure in rehabilitation
plagued with violence
40% of youths end up
entering adult prisons
returning to the juvenile system
the evaluation process
youth housed in these facilities
contributing to unsafe conditions
no revenue for infrastructure projects
Habitats removed
Reduces biodiversity
income earners
44 for economic activity
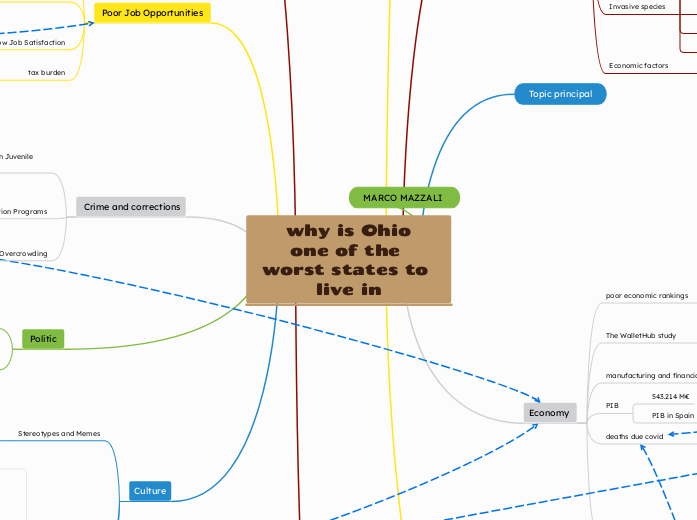
why is Ohio one of the worst states to live in
Society
education inequities
low-income Schools
lack of
resources
funding
limited access by socioeconomic status
and geographic location
issues
inequality
poverty
lack of basic necessities
housing
food
more food banks
due rising food prices
significant economic changes
rise of service-oriented employment
decline of manufacturing jobs
Culture
economic challenges
causes
impact cultural vibrancy
things to do
almost nothing to do
+bad activities
Stereotypes and Memes
bad state
pepople makes memes
3. meme
2. meme
1. meme
Politic
Corruption
larry householder
accepted a $61 million bribe
linked to
legislation that benefited utility companies
ex-president
gerrymandering (manipulation)
77% of Ohioans
live in districts
were elections are not serious
manipulated electoral districts
lack of competitive races
Crime and corrections
Staffing Shortages and Overcrowding
no income
leads to
no support
inadequate supervision
Ineffective Rehabilitation Programs
children who enter the juvenile justice system
come out worse than when they entered
due to
and trauma
exposure to violence
High Rates of Violence and Neglect in Juvenile Facilities
prisions
centers
Poor Job Opportunities
tax burden
considered high
for
middle
Low Job Satisfaction
Job satisfaction levels
low
High Unemployment Rate
unemployment rate
national average
4.2%
4.5%
fewer jobs are available
compared to
number of individuals seeking work
low employment growth
less than 1.6%
Education
Racial Segregation
issue
with Black students
attending schools that are under-resourced
leads to unequal opportunities
Impact of covid-19
impacting
exacerbating inequalities in educational
access
quality
readiness for kindergarten
teachers
poor working conditions
low salaries
education quallity
economically disadvantaged students
attend underfunded schools
areas with high poverty rates
taxes exacerbates these disparities
worst education
depending of your zone
Complicated Metrics
K-3 Literacy Improvement Grade
K-3 Literacy Component Grade
ODE
The Ohio Department of Education
School Report Card system
criticized for its ineffective
Infrastructure
Political Factors
budget is going to
a less more to
healthcare
education
transportation
security
to the state
Economic Challenges
due covid-19
Insufficient Funding
increases
vehicle registration fees
gas taxes
Aging Infrastructure
public transit systems
bridges
roads
Economy
Growth rate of 1,5%
deaths due covid
41.796
a lot of unemployment
PIB
PIB in Spain
1.498.324 M€
543.214 M€
manufacturing and financial activities
weakened since late 2021
two of Ohio’s largest sectors.
The WalletHub study
assessed economic activity
28 more metrics
innovation potential
economic health
poor economic rankings
42 out of all states
MARCO MAZZALI
Topic principal
Natural environment
Economic factors
low income comunities
no solutions fort climate change
Invasive species
much more...
garlic mustard
autumn olvie
asian longhorned beetle
asian carp
Habitat loss
90% of westlands lots
Farmland expands
Cities grow
Pollution
lot of vulnerable people
Poor people
Sick people
Elderly
Children
More humidity
Bad air quality
Affects to human health
Strokes
Dehydration
Climate change impacts
Less snowfall in the winter
Incoming decades
Extremely hot days
113 degrees
More frequent floods
Ice cover melting
Healthcare
Insufficient Public Health Investment
Ohio spends less on public health
Healthcare Affordability Issues
healthcare affordability burdens
53% of adults
Causes
delaying necessary medical care
High premiums costs
Infants deaths
5.4 per 100.000
7.1 per 100.000
Insurance coverage
Covers
Uninsured
18 -64 years
Insured
All ages
Maternal deaths
U.S
26.3 per 100.000
Ohio
28.4 per 100.000
Top 5 worst healthcare
5. Ohio
4. Kentucky
3. Tennessee
2. Mississippi
1. West Virginia
Smoking and drugs
Including:
Illicit drugs
Alcohol
Vaping
Cigarettes
20% Ohioans smokers

