Use the break-even analysis template to calculate how much you will need to sell until you make a profit. See how total fixed costs, price, volume, and other factors affect your net profit. Any company plans how to market and sell its goods or services to generate revenue. Every business owner should do a business plan when he starts the business. Organizing finances is a part of a business plan. No other part of your business plan can be implemented without it. Also, calculating the break-even point is the most important part of your financial organization. This analysis is mandatory for any companies, strating from a small busines to big ones. The Break-even analysis (also called cost-volume-profit CVP analysis) is a way to determine how changes in variable and fixed costs affect a firm's profit. This template helps you find out what amount of sales, or units sold, is required to break even after incorporating all fixed and variable costs of running the operations of the business. Instead of doing this analysis in Excel, you can use this template that is created especially for finding the fixed costs, the variable cost total, and the variable cost per unit. After you have learned more about them and figured out exactly what they are and how they are related to your business, the template helps you in calculating the break-even point. The main difference between this template and analysis in Excel is that the template offers you an overview of the main things you should take into consideration when you are doing the break-even analysis. Also, unlike the analysis in Excel, it offers you an indication to realize this analysis. Some of the reasons for using this template to do a cost volume profit (CVP) analysis are the determination of profitability, selecting the sale price required to break-even, and calculating the fixed and variable costs, and analyzing data. Revenue generation is one of the most important activities any business can engage in. It is defined as a process by which a company plans how to market and sell its products or services, to generate income. The profit and loss statement is a financial statement that summarizes the revenues, costs, and expenses incurred during a specified period, usually a fiscal quarter or year. The Break-even analysis helps you price goods or services you are offering on the market. Do some research and find competitor's sale price. Then try to establish your sale price. Analyzing the data helps you reduce the total fixed costs, reduce the variable costs per unit, and improve sales. To calculate the net profit, you have to know the fixed and variable costs. The success of a business rests on its ability to adjust and adapt to improve earnings. Think about some ideas to reduce your overall fixed costs and add them to the template. Costs per unit detail how much you charge for each unit of an item sold. Unlike fixed costs, costs per unit vary when production levels increase or decrease. Think about some ideas to reduce the variable cost per unit. To improve the sales in your business, focus on the customers and shift to increasing sales performance. The sales price per unit is the amount a company charges for a single item of a product or use of a service. Setting the sales price per unit is an important decision for a business owner because it has a direct effect on sales volumes. If you want to find the sales price per unit from the income statement, you have to divide sales by the number of units sold. To monitor and control your selling costs or cost per unit, you need to determine the sales price per unit for each item from your company inventory. Profit and loss are related to total revenue, costs, and expenses. The total revenue is just the price multiplied by the number of units sold. There are two types of costs that you can analyze using this break-even analysis template: fixed and variable costs. Fixed expenses are those costs that do not fluctuate, like rent, insurance, dues or subscriptions, depreciation, salaries, and advertising. They remain constant throughout the payback period, regardless of the number of units sold. You will need to find out what your net profit per unit sold is and divide your fixed costs by that number. This will tell you how many units you need to sell before you start earning a profit. The payback period refers to the amount of time it takes to recover the cost of an investment. In other words, the payback period is the time until a business reaches the break-even point. Examples of fixed costs are: Rent or mortgage Labor cost Insurance Property taxes Interest Advertising Standing orders License or membership fees The average price of shares is the total amount invested by the total number of shares bought. Variable cost total change as the quantity of the good or service that a business produces changes. In other words, variable costs change with the number of units sold. Variable cost per unit is the production cost for each unit that is affected by changes in a firm's output or activity level. Also, calculate the contribution margin. It tells you how much margin or profit is being earned from sales after subtracting the variable cost total to produce the units. It is calculated with the following formula: the sale price required to break-even minus the variable cost. Before calculating the break-even sales, it is necessary to know the contribution margin. You can find the break-even sales if you divide the total fixed costs with the contribution margin. The break-even point is the level of production at which the costs of production equal the total revenue for a product. In other words, after you reach the break-even point, any additional sales will generate profits. Use this template to calculate it. Moreover, a business is not only about profit, you need to track more data. Always take calculated risks and have in mind the safety and sustainability od your company. Thus, it is important to be aware of the margin of safety, which refers to how much the sales level can fall before your business reaches this break-even point. Starting any business has a price. Be prepared to cover those costs. Use this formula to find the break-even point. What is the break-even point? What are the variable costs? What is the average price? Fixed expenses or costs are those that do not fluctuate with changes in production level or sales volume. What are the fixed costs? The Break-even analysis helps you analyze the data. To improve the sales in your business, focus on the customers, and shift to increasing sales performance. How can you reduce the variable costs per unit? How can you reduce your overall fixed costs? The Break-even analysis helps you price a product or service. Do some research and find competitor's prices. Price What are the competitor's prices? The Break-even analysis helps you determine profitability. The profit and loss (P&L) statement is a financial statement that summarizes the revenues, costs, and expenses incurred during a specified period, usually a fiscal quarter or year. Type idea Revenue generation is one of the most important activities any business can engage in. Os mapas mentais ajudam você a fazer brainstorming, estabelecer relações entre conceitos, organizar e gerar ideias. No entanto, os modelos de mapas mentais oferecem uma maneira mais fácil de começar, pois são estruturas que contêm informações sobre um assunto específico com instruções de orientação. Em essência, os modelos de mapas mentais garantem a estrutura que combina todos os elementos de um assunto específico e servem como ponto de partida para o seu mapa mental pessoal. Eles são um recurso para fornecer uma solução prática para criar um mapa mental sobre um determinado tema, seja para negócios ou educação. Mindomo traz modelos de mapas mentais inteligentes que permitem que você funcione e pense sem esforço. Você pode escolher entre uma variedade de modelos de mapas mentais das contas comerciais ou educacionais da Mindomo, ou pode criar seus próprios modelos de mapas mentais do zero. Qualquer mapa mental pode ser transformado em um modelo de mapa mental adicionando mais notas de orientação a um de seus tópicos.Break even analysis template
Find out how much money you need to start a business with a break-even analysis.
It will help you determine when your business will become profitable.
Keywords: business analysis, break-even analysis, profitability, variable costs, average price, fixed costs, data analysis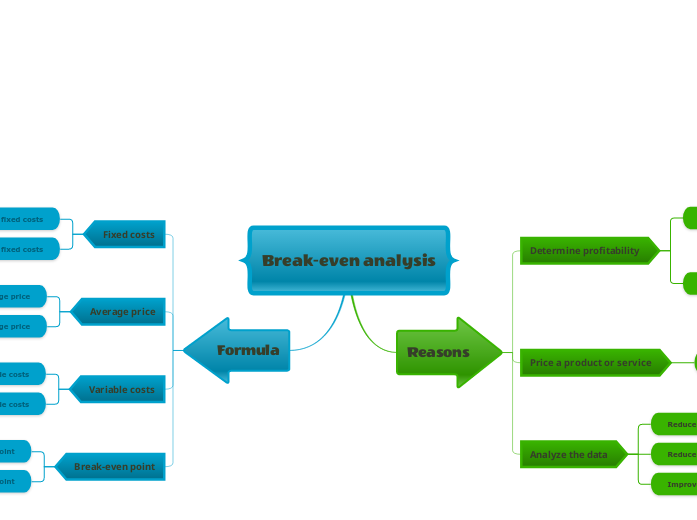
Break even analysis template
Reasons to do a break-even analysis
1. Determine profitability
Total revenue
Profit vs. loss
2. Price goods or services
3. Analyze the data
Reduce the total fixed costs
Reduce the variable costs per unit
Improve sales
Cost volume profit (cvp) analysis
Total fixed costs
Average price
Variable costs
Calculating the break-even point
Break-even analysis
Formula
Fixed Costs / (Average Price – Variable Costs) = Break-Even PointBreak-even point
Determine break-even point
The break-even point is the level of production at which the costs of production equal the revenues for a product.
Fixed Costs / (Average Price – Variable Costs) = Break-Even PointVariable costs
Type variable costs
Variable costs are costs that change as the quantity of the good or service that a business produces changes. Variable costs are the sum of marginal costs over all units produced.Average price
Type average price
To calculate the average purchase price of your shares you have to divide the total amount invested by the total number of shares bought.Fixed costs
They include such expenses as rent, insurance, dues and subscriptions, equipment leases, payments on loans, depreciation, management salaries, and advertising.Type fixed costs
Fixed expenses or costs are those that do not fluctuate with changes in production level or sales volume.
They include such expenses as rent, insurance, dues and subscriptions, equipment leases, payments on loans, depreciation, management salaries, and advertising.Reasons
Analyze the data
Improve sales
How can you improve sales?
Choose from the ideas below or add others.Reduce the variable costs per unit
Variable cost per unit is the production cost for each unit produced that is affected by changes in a firm's output or activity level.
Unlike fixed costs, these costs vary when production levels increase or decrease.Reduce overall fixed costs
The success of a business rests on its ability to adjust and adapt to improve earnings.
Examples of fixed costs:Price a product or service
Competitor name
Then try to establish your prices.Determine profitability
Profit vs. loss
Which products or services turn a profit and which ones are sold at a loss?Generated revenue
It is defined as a process by which a company plans how to market and sell its products or services, in order to generate income.
How much revenue do you need to generate to cover all your expenses?Por que usar um modelo de mapa mental Mindomo?
Um modelo possui várias funcionalidades:


