Funnel diagrams or funnel charts are all about visualization and help represent a significant amount of data through them. Creating a funnel is about showing the various stages in a process, with data behind it as needed. It’s best to use diagram software to build funnel diagrams as there are a lot of updates they will have.
What is a funnel diagram used for?
The primary usage of a funnel diagram many people first encounter is as part of a sales process. A funnel diagram is then called a sales funnel or sales pipeline. It’s meant to track the stages of a sales process and how many are at each stage. This was first designed over 100 years ago by a man named E. St. Elmo Lewis. It was originally called the purchase funnel and is still used today as part of the marketing and sales process.
Since every industry generates sales revenues, they can get benefit from creating a funnel chart. This also created one of the first funnel templates that covered current marketing terms. It also helped to show the initial thinking of each stage in a sales process.
It can also be used as a brainstorming tool to help generate ideas in various aspects of a business. Areas such as problem-solving or process improvement will easily benefit from the use of a funnel chart.
How do you create a funnel diagram?
You need to first understand the purpose when creating a funnel chart. What will your funnel charts show? Are they meant to be working tools, or will your funnel charts show informational items? Either way, the process should be relatively the same, yet one will be modified from time to time.
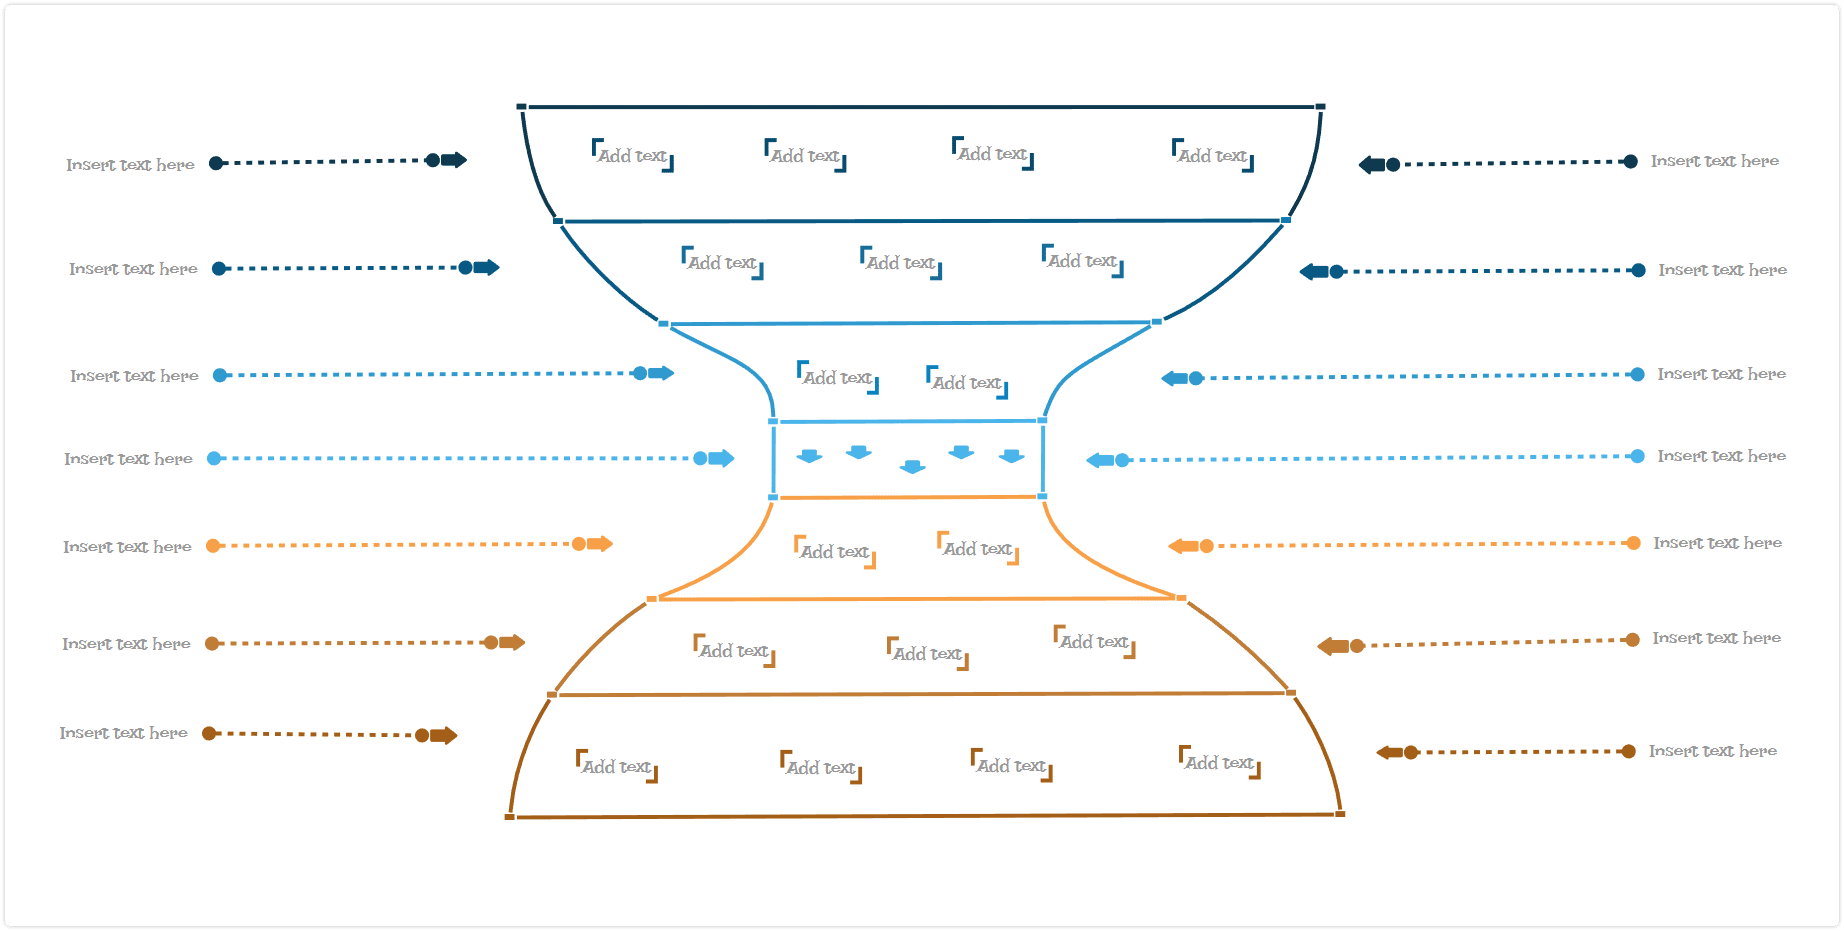
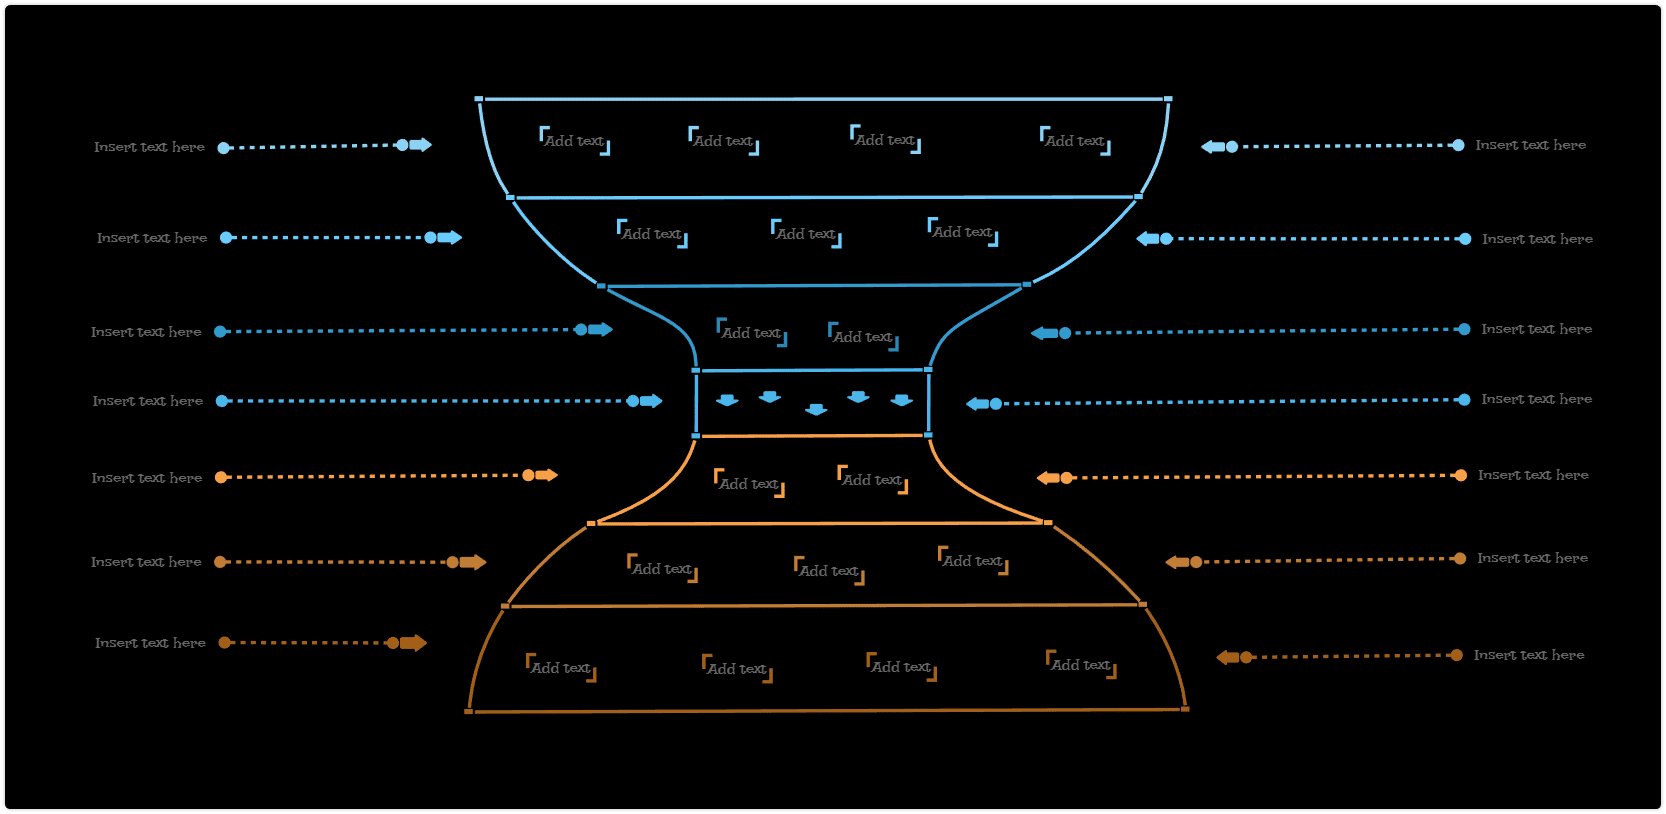
The easiest way is to create a funnel diagram starting from a predefined template and then fill it out and customize it. You can use a simple funnel diagram template or even an hourglass funnel diagram template like these ones:
1. Select your categories
In a funnel chart, you will have a process flow. For example, when a prospect passes from one phase to the next phase, they become a sales call. This goes down each stage in a sales process until that lead becomes a returning customer, advocating the product. A typical example of each step in a sales pipeline can be as such:
- Leads
- Sales Call
- Follow-up
- Conversion
- Sales
2. Understanding each layer
Typically with any funnel templates, the top is larger than the bottom. That’s because of the process flow of a typical sales pipeline. That means the Leads portion will be the largest above, with the highest data point. As one passes from one phase down to the next, data is reduced. That’s because they’re slowly becoming refined and on their way to converting into sales.
3. Combining other data forms
Consider including a bar chart with your funnel templates or a pie chart. A bar chart helps to represent other actionable and relatable data points. Keep in mind that a bar chart can also be part of the funnel template. A pie chart will help show time spent on activities as they are a percentage of the whole. You’re already going to have a reduction of data down the sales pipeline. It can be good to add more specific data sets along the way.
4. Color Code
Try your best to incorporate colors to differentiate the different pools of data. It will help to become a better graphic organizer. It will also help if you want to visualize this with a different data style, such as a bar chart that’s also color coded the same way.
Where is a funnel diagram used?
While creating a funnel chart is primarily used for some sales pipeline representation, it has other uses. The reason it’s such a popular sales tool is because of how iterative it is for an often stressful position. Instead of just breaking down between leads to sales, it helps represent key steps and success rates at each level.
Another thing to note is that they can be actionable items. You can easily turn them into a funnel diagram infographic. This can showcase a process flow visually and stages in a process or even represent data sets. It can be a way to generate ideas for developing new variants of a stage in sales or operational efficiencies.
Besides its use case with sales, we can find creating a funnel chart useful in other areas as well. For example, it can be used in recruitment as a selection process visualization. From candidates that have applied to be screened to those actually hired, it can show data points to improve the process. For example, the figures can show the whole amount of total applicants and the percentage at each stage.
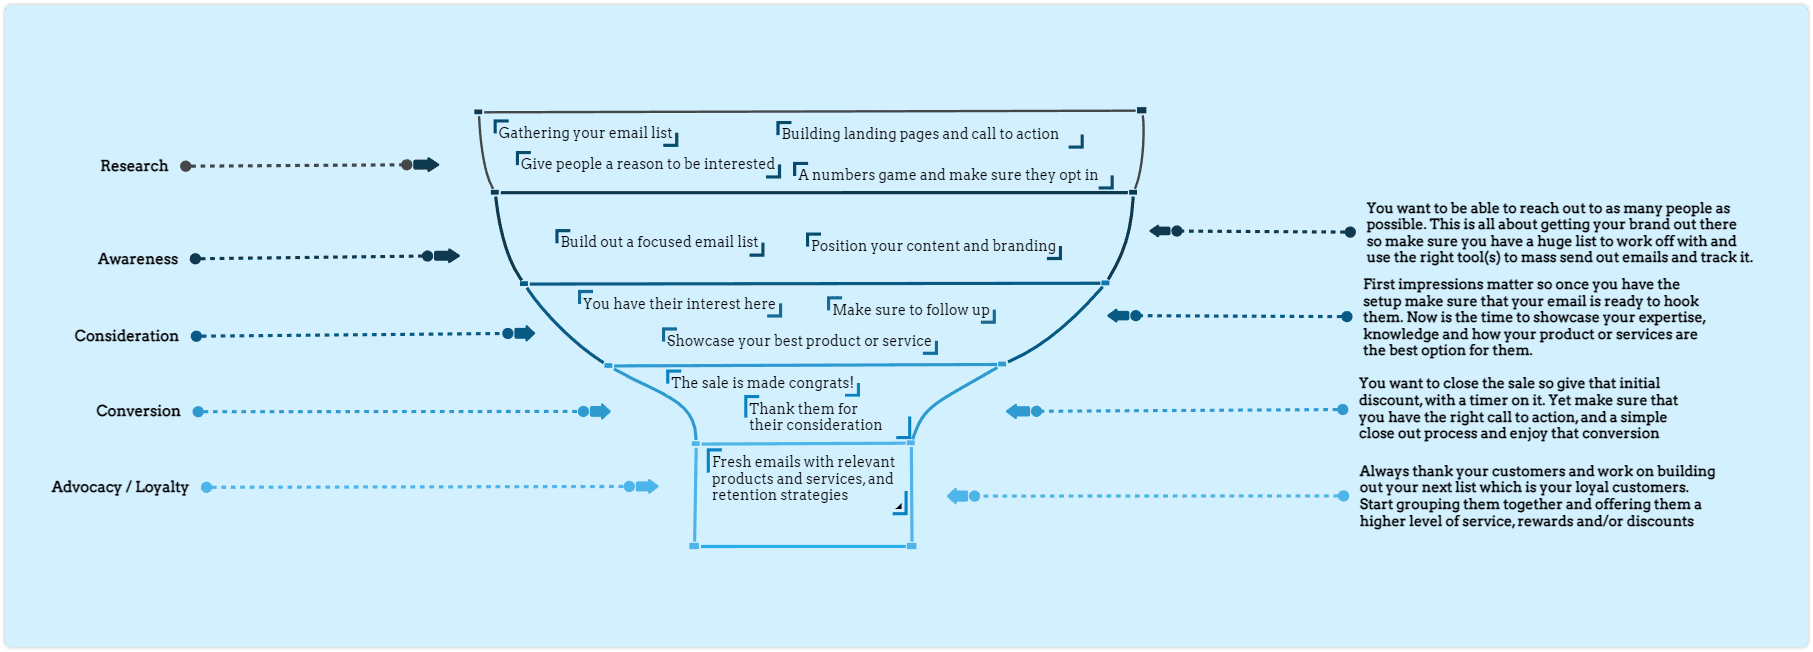
One can create a funnel chart to showcase marketing efficiencies, and we can take a look at each stage of the process flow for an email marketing campaign. This example will have figures such as emails sent, all the way down to converted sales. Once the figures are in place, we can see where there is room for improvement. These can be clickthrough rates to emails being opened. All the while, it helps the team to improve the process flow.
Funnel Diagram Example
An excellent example of how to use funnel diagrams in an advanced sales and marketing pipeline is below:
Using the right funnel templates can even be done for operational aspects such as order fulfillment. This can help showcase bottlenecks in operational process flows. Whether it’s too few orders being sent out, or too many returns happening, the funnel charts show actionable items. You can also use it in the same area as a funnel diagram infographic for training purposes.
Software to visualize and collaborate
Instead of generating ideas on paper, finding the right diagram software can help. Mindomo helps you to have a graphic organizer and a set of funnel templates to collaborate from day one. You can visually lay out all the necessary stages in a process when you create a funnel chart on Mindomo. As always, you can expand your usage as needed, but Mindomo always has a free version to use. You can work to create powerful visuals through the creation of funnel charts, and you can begin whenever ready.
Keep it smart, simple, and creative!
The Mindomo Team