Study after study reveal that visual aids offer learners a host of benefits. They help with everything from improving understanding and recall to making organizing information easier. That’s why graphic organizers are an essential tool for teachers and students alike.
What is a graphic organizer?
Graphic organizers are helpful tools that visually represent information and can be used to organize thoughts and ideas. They’re great for brainstorming, planning, categorizing data, and more.
But what many fail to realize is that there’s not just one kind. There are dozens of different types of graphic organizers, each designed to meet a specific need. Some of the more common ones include Venn diagrams, mind maps, and flowchart diagrams.
That’s why it’s worth familiarizing yourself with the various types of graphic organizers. Once you understand them, you’ll be able to put a limitless number of graphic organizer templates to work for you.
That way, no matter what the situation, you’ll be ready to benefit from these powerful visual aids.
What are the benefits of graphic organizers?
One of the benefits of using graphic organizers is that they can help students make connections between different concepts. For example, a Venn diagram can be used to show the similarities and differences between two topics. Timeline diagrams can be used to see how events are related, even though separated by geography or time. And mind maps are helpful for seeing how big ideas can be broken down into smaller ones.
By seeing the information laid out in a logical way, students will be able to understand complex concepts more easily.
But graphic organizers don’t just aid comprehension. They’re also a powerful memory aid, allowing students to recall information more readily. The right visual can lodge an idea, sequence, or event deeply into a learner’s mind.
On top of all that, graphic organizers are incredibly helpful for brainstorming and planning. If a student is working on a project or paper, a mind map is the perfect place to start. It allows them to think through the entire thing beforehand, so they don’t waste time chasing rabbit trails.
When it comes to learning, graphic organizers are an invaluable tool. Here’s a look at five of the most popular types and how they can help teachers and students.
What are the 5 types of graphic organizers that are most often used?
When it comes to graphic organizers, there is no one-size-fits-all solution. The best approach depends on the nature of the material and the goals of the learner. With that in mind, here are five of the best types of graphic organizers for teachers and students alike.
1. Mind Maps
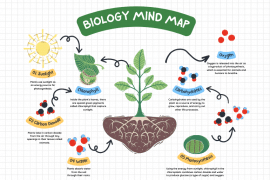
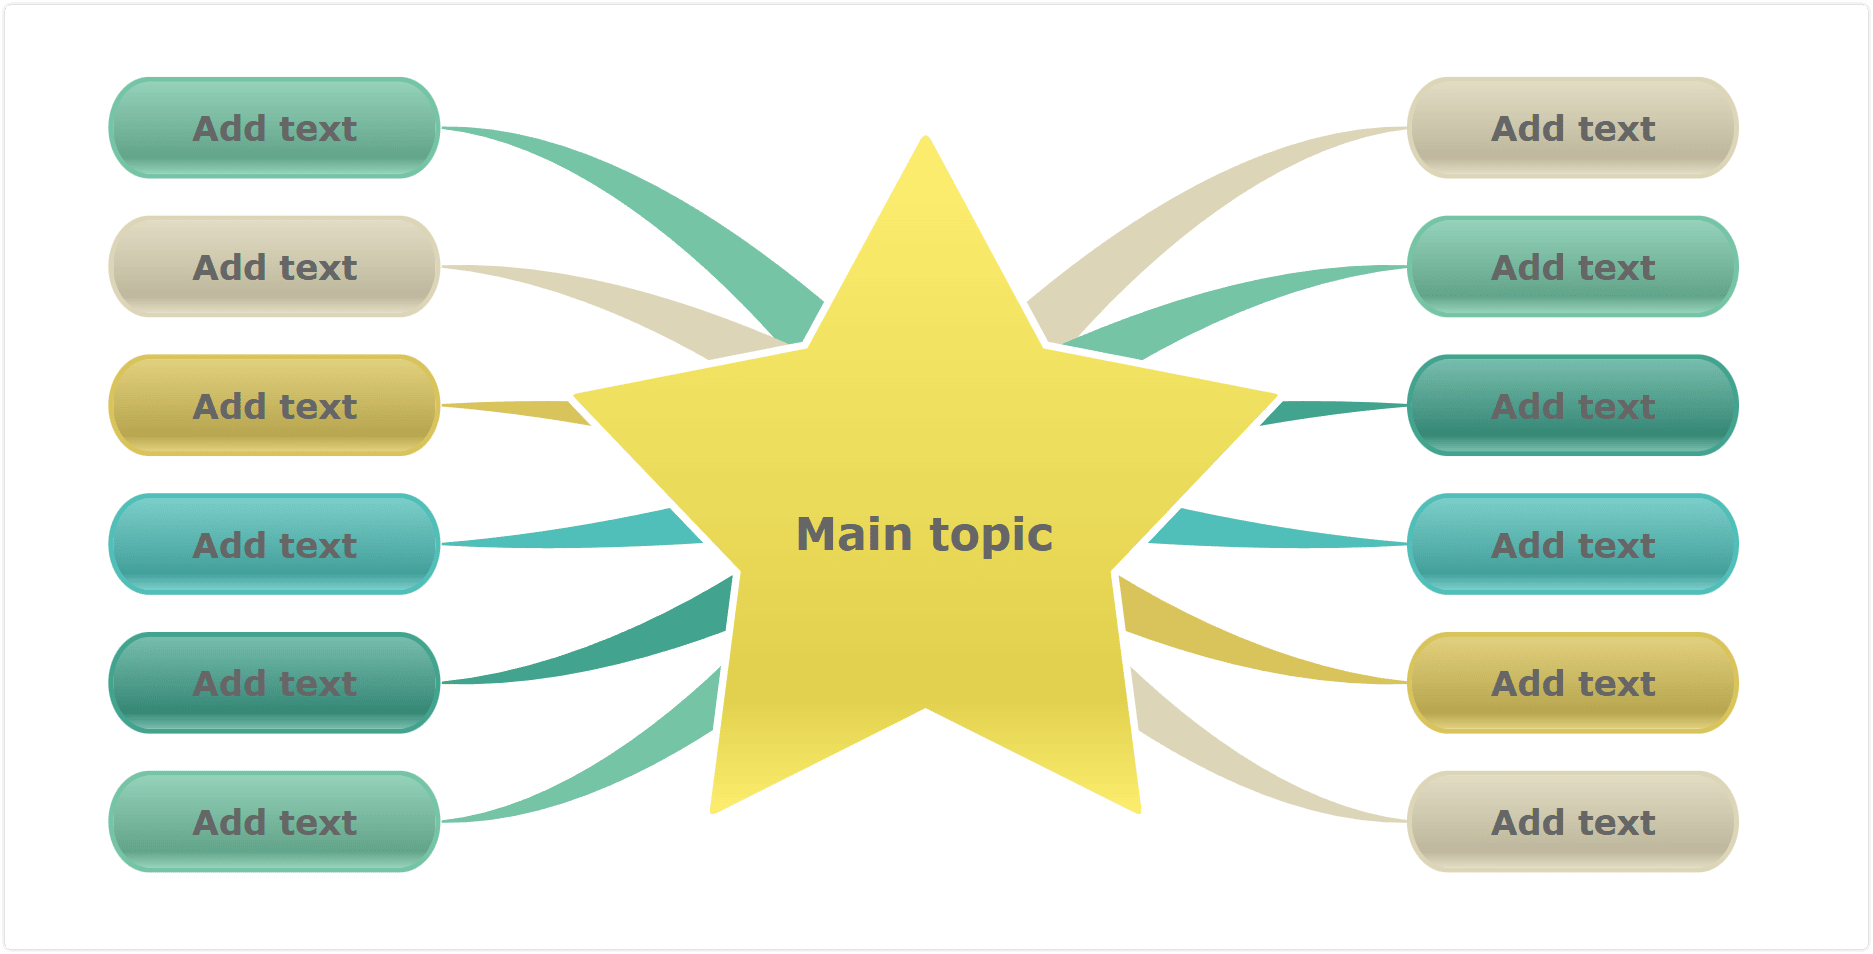
A mind map is a flexible tool that can be used for brainstorming, taking notes, or organizing ideas. It’s especially well-suited for visual learners or those who prefer a non-linear approach to learn (find out more about what is visual learning here). Mind maps allow learners to quickly capture ideas and make connections between them.
Mind maps can also help students to see the big picture and make complex problems more manageable. For example, a student might create a mind map to organize their thoughts on a challenging essay topic. Because of their versatility, mind maps can be used by teachers and students in almost any subject.
2. Concept Maps
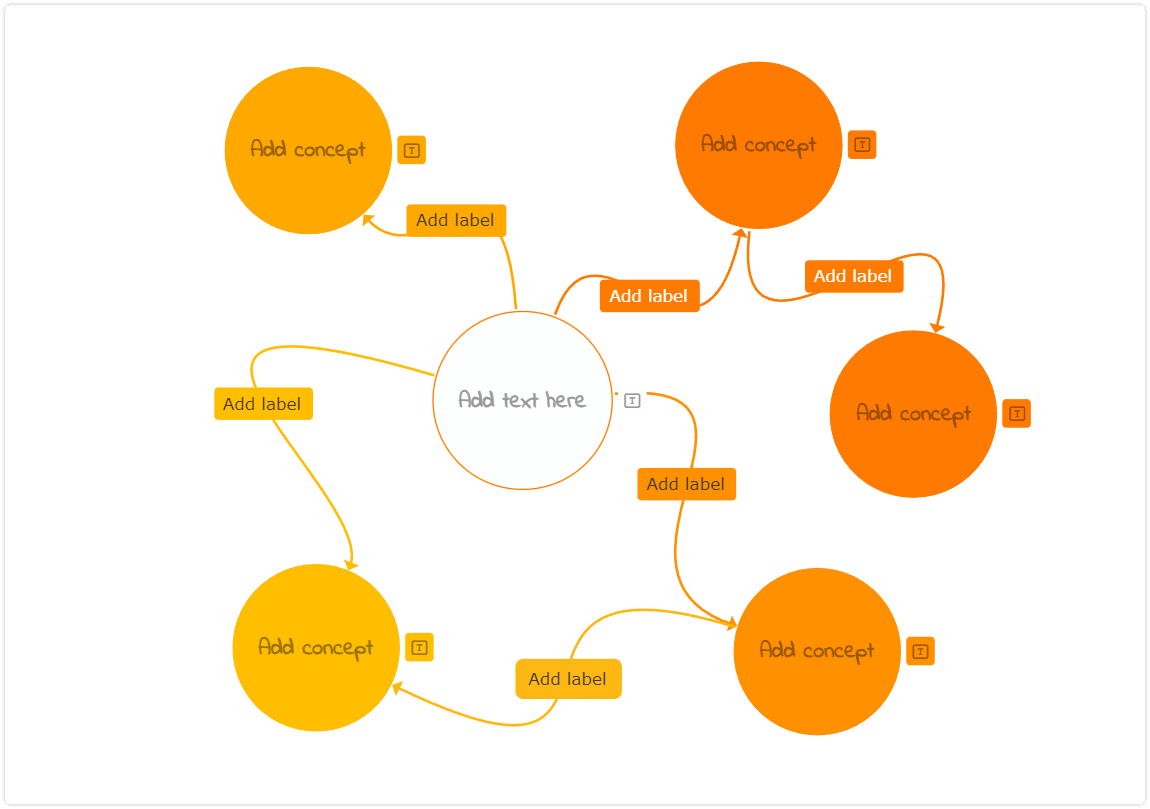
The concept map is similar to a mind map, but the main difference between a concept map vs mind map is that the first one is more focused on showing relationships between multiple concepts. It’s often used in fields like science and engineering, but it can also be helpful for students who are struggling to see the big picture.
Concept maps are especially useful for understanding abstract ideas or theories. For example, a concept map could help students to understand the roles of individual countries in the European Union. It could also be used for mapping out a complex theory or concept like natural selection or the law of supply and demand.
3. Flowchart Diagrams
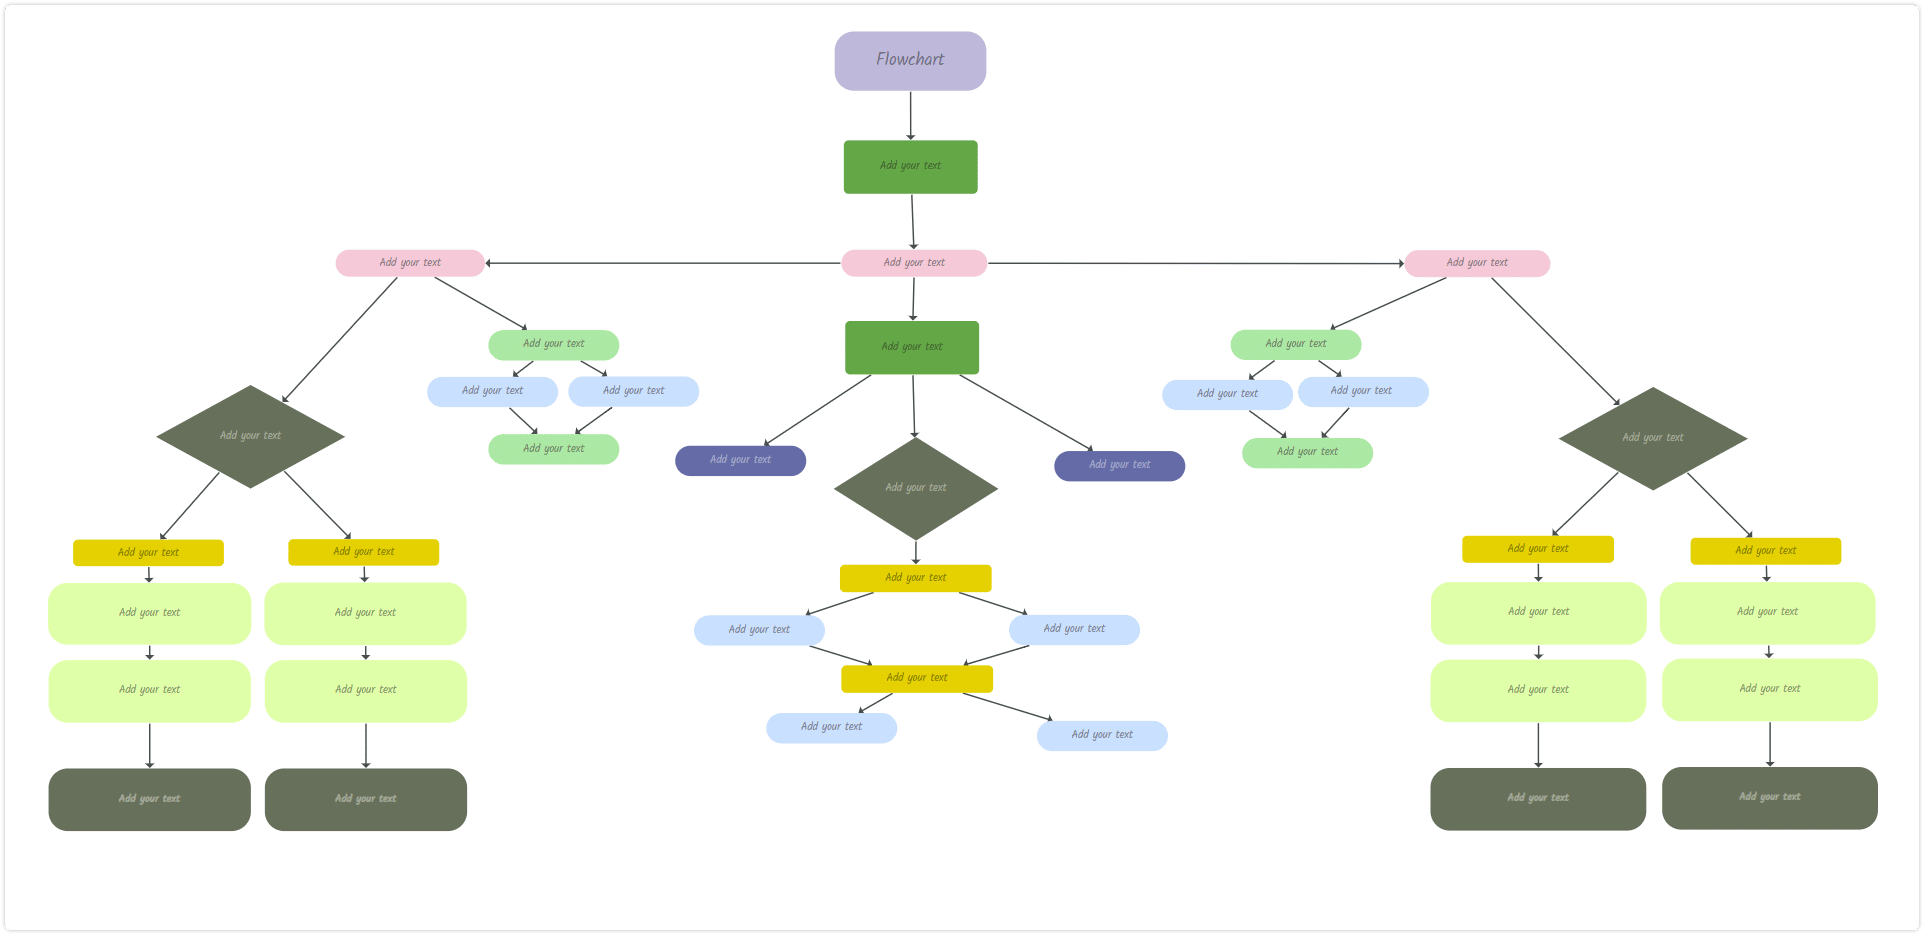
Flowchart diagrams are a great way to visualize a process or sequence of events. They’re often used in business and computer programming. But they can also be helpful for students who are trying to understand complex concepts. For example, a flowchart diagram can help students to understand the process of photosynthesis or the steps in a historical event. This makes them an ideal choice for science and history classes.
4. Timeline Diagrams
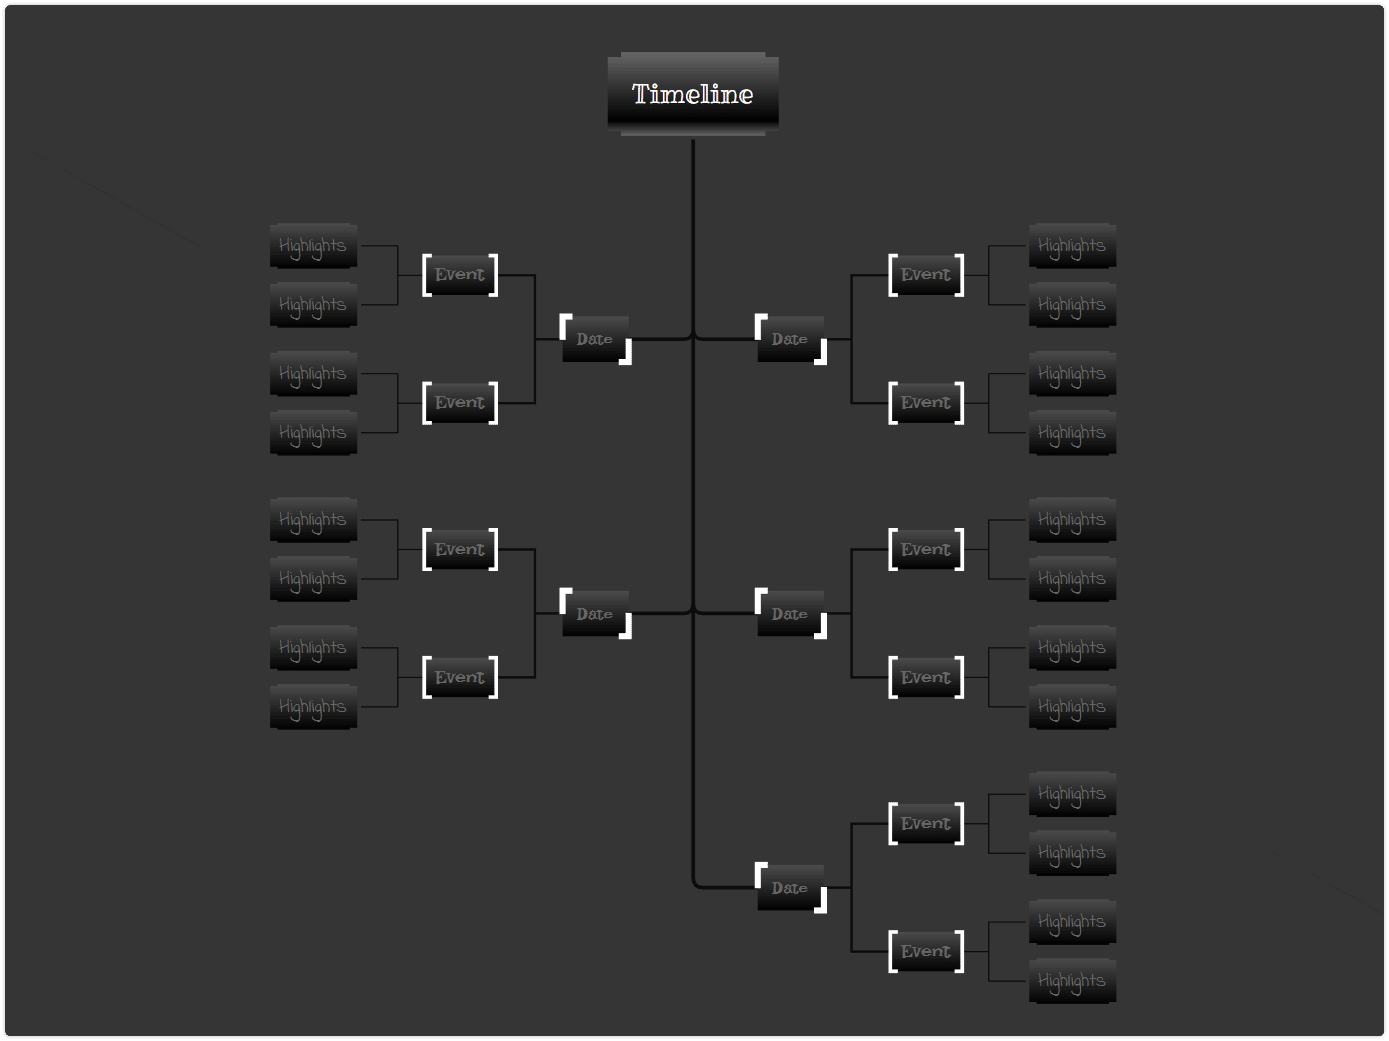
The graphic timeline is a useful tool for visualizing historical events or tracking the progress of a project over time. It can also be helpful for students who need a way to organize information chronologically. This makes them particularly valuable in history classes. However, they can also have some other, perhaps more surprising uses.
5. Venn Diagrams
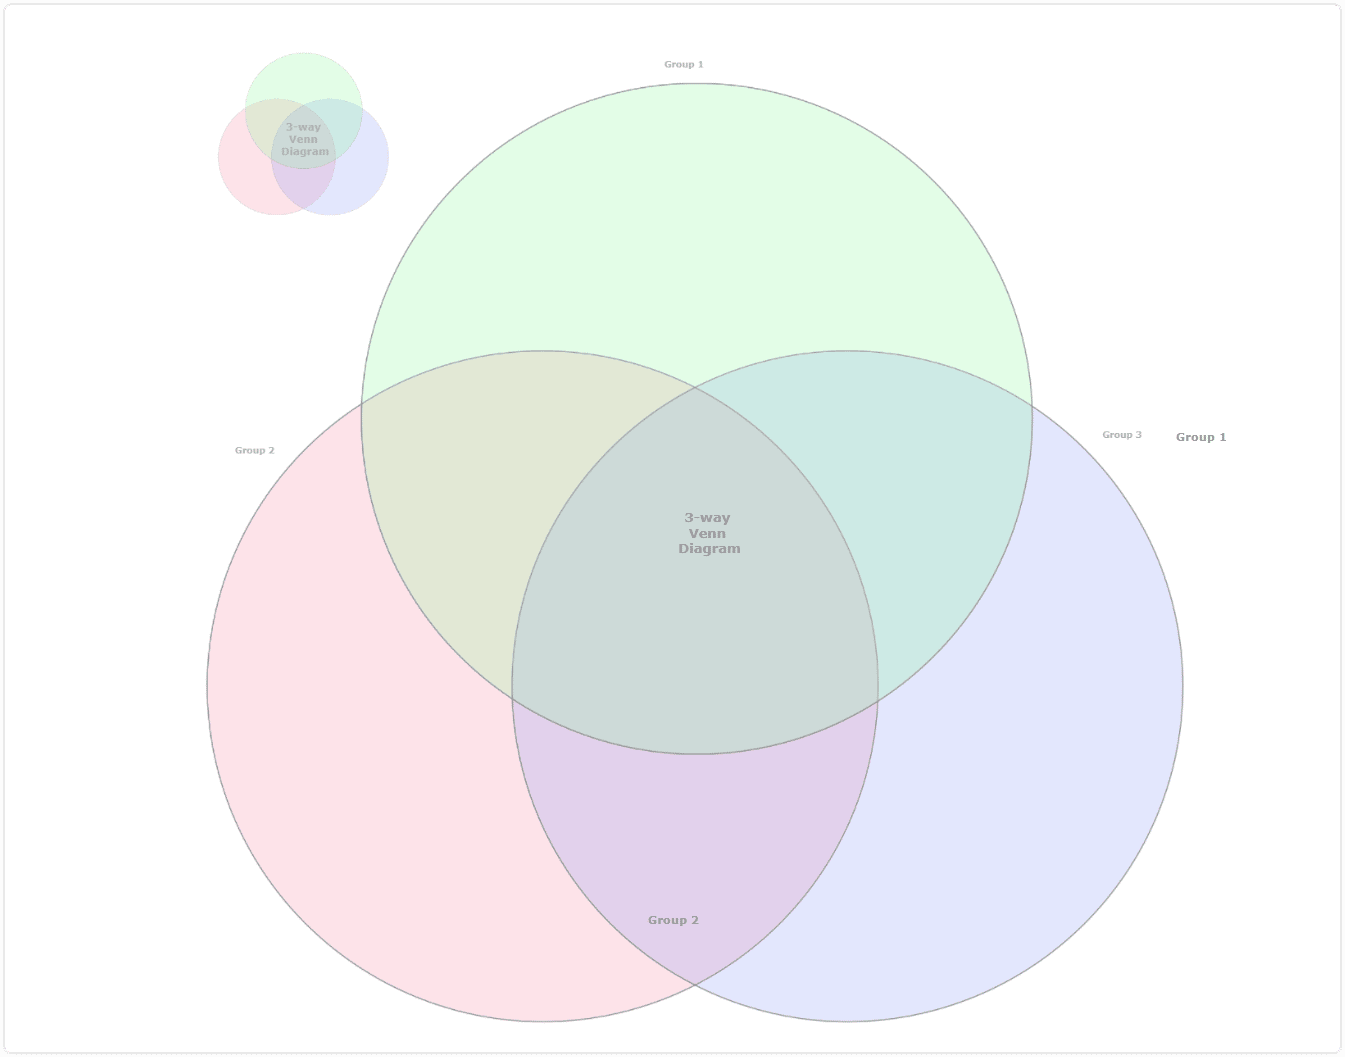
The Venn diagram is a classic tool for comparing and contrasting two or more things. It’s simple yet effective, especially for deep analysis. They can help you spot patterns and relationships that might not be visible when looking at data in isolation.
Venn diagrams can also be helpful for understanding concepts that are difficult to visualize. For example, Venn diagrams can help you map out the relationships between abstract ideas such as morality and law. Imagine a Venn diagram that examines the moral and legal dimensions of a controversial issue like abortion.
Venn diagrams can be particularly helpful when preparing for a paper, presentation, or debate. That’s why they make such useful tools within English and social studies classrooms.
How do you make a graphic organizer?
You can get started creating graphic organizers with nothing more than a pen and some paper. But you’ll need mind mapping software if you’re going to get the most out of them. The right mind mapping software will allow you to quickly create all kinds of mind maps. You’ll be able to edit them on the fly without erasing everything and starting over from scratch. And you’ll be able to add photos, videos, audio recordings, other files, and links – without any effort at all.
Most mind mapping software also includes the ability to use concept map templates to get you started. So, creating your first mind map will be a snap.
Creating graphic organizers with Mindomo
While there are dozens of options out there, Mindomo is a great first choice for making graphic organizers. You can use it to brainstorm ideas, take notes, or organize information. It’s flexible and easy to use. And it’s perfect for visual learners or those who prefer a non-linear approach to learning.
The easiest way to get started is to figure out what kind of chart you need. Whether it’s a flowchart diagram, timeline diagram, or something in between, Mindomo has the graphic organizer templates you need. Simply choose from Mindomo’s many graphic organizer templates and get started.
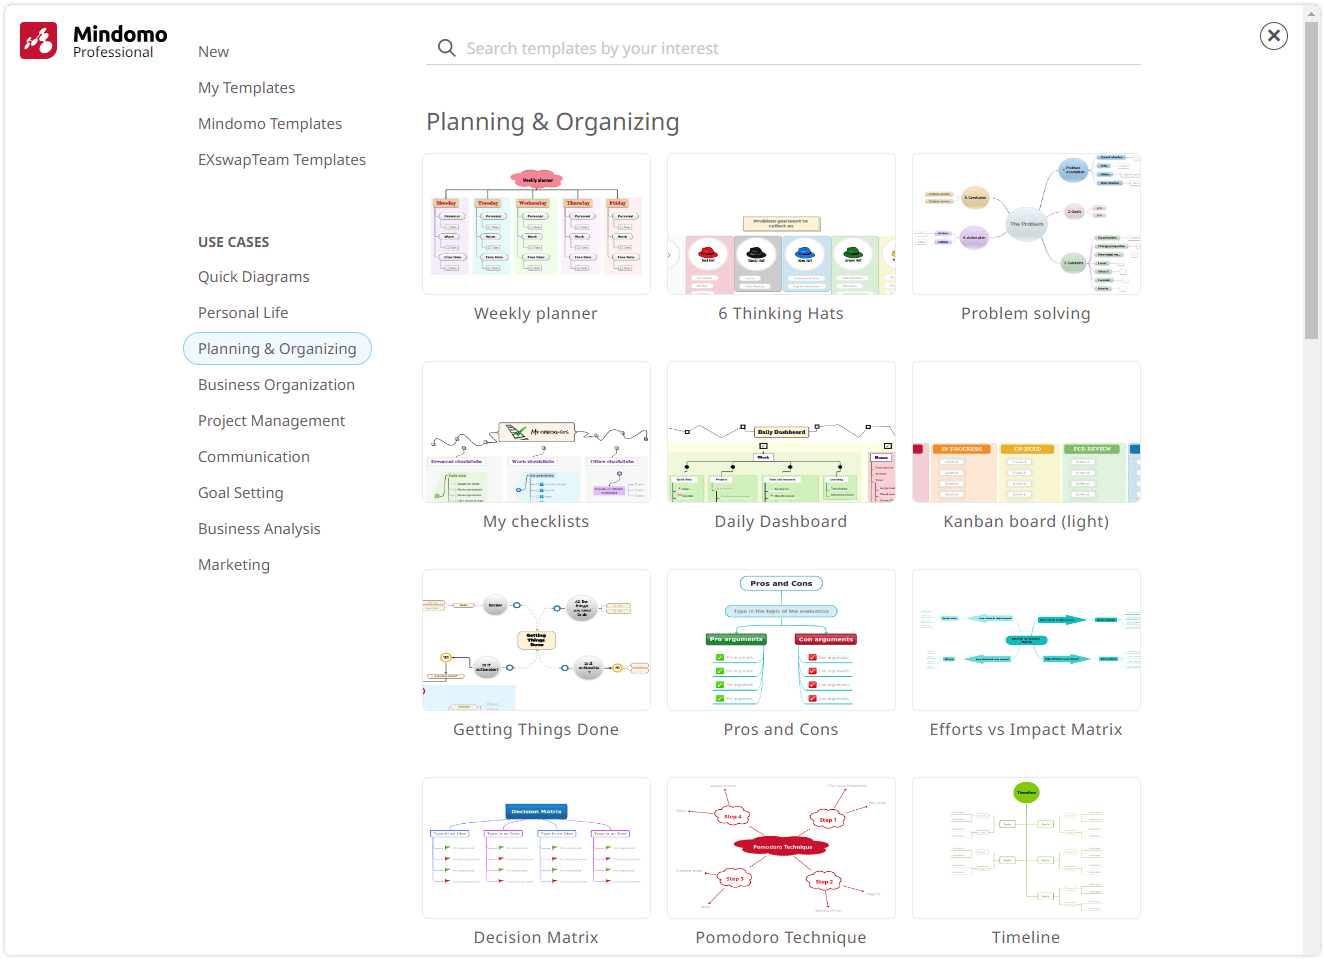
Once you’ve chosen a concept map template, you can begin editing it to fit your needs. Enter your main topic or idea where it belongs on the concept map template. From there, you can add branches for sub-topics and add details to each branch.
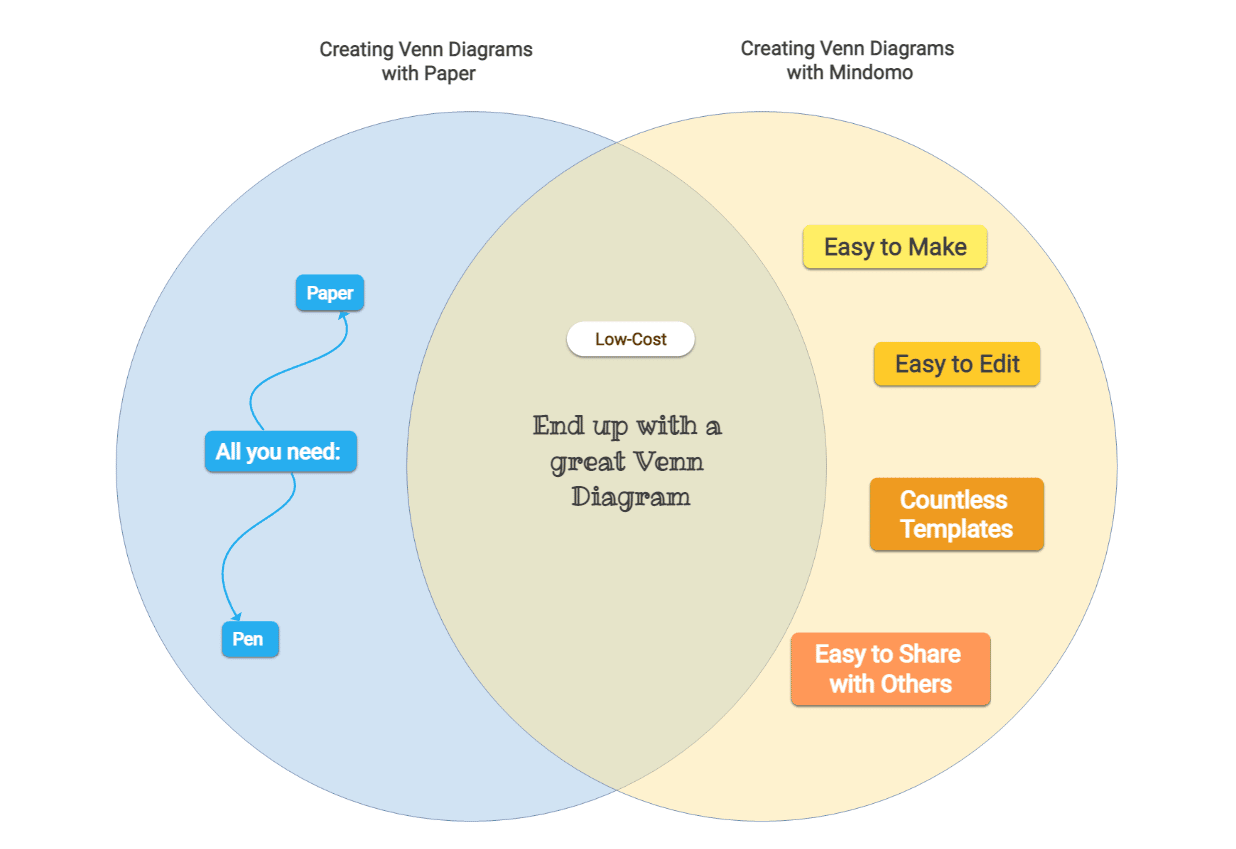
You can also add links to other maps or web pages, and you can embed multimedia files like videos and images. You can use shapes and arrows to help illustrate relationships between different elements. Once you’ve finished, you can even use colors to make the organizer look more appealing.
And there you have it! You’ve just created your very own graphic organizer. Now you can use it to help reinforce concepts, remember information, and plan projects. So put your new skills to good use and get organized!
A few parting thoughts
Graphic organizers are a great way to help students learn and remember new information. Students can use graphic organizers to make connections between different concepts and organize their thoughts in a meaningful way. And teachers can use them to craft more effective lessons that stick. Mindomo offers all the tools and graphic organizer templates you need to get started.
So, why not give it a try?
Keep it smart, simple, and creative!
The Mindomo Team

