

Diagram templates: 15 free templates you can edit online
A diagram template is a ready-made diagram with its shapes, connectors and layout already in place. You copy it, type your own content into it and keep the structure, instead of drawing boxes and lines from scratch.
Below are 15 free templates for the diagrams people make most, grouped by what they show: a process, a comparison, a decision, the causes of a problem, a structure, or how ideas connect. Each one opens in Mindomo, where you can edit it, share it with your team and export it.

On this page
Which diagram do you need?
Start from what the diagram has to show. Each row links to the templates for it further down the page.
How a process runs
A flowchart for steps and decisions, a cycle diagram for steps that repeat, a timeline for events in order, and a Kanban board for work moving through stages.
What two or three things share
A Venn diagram for what overlaps and what does not, with three circles for three groups, and a T-chart for two lists side by side.
Which option to choose
A decision tree for options and their outcomes, an impact vs. effort matrix to rank tasks, and a SWOT analysis to weigh a strategy.
Why a problem happens
A fishbone diagram for the possible causes of one problem, and an issue tree to break a big question into smaller ones you can check.
Who or what sits where
An org chart for a company or a team, and a family tree for a family’s generations.
How ideas connect
A concept map when the relationships need labels, and a mind map when you are collecting ideas around one topic (see the mind map examples).
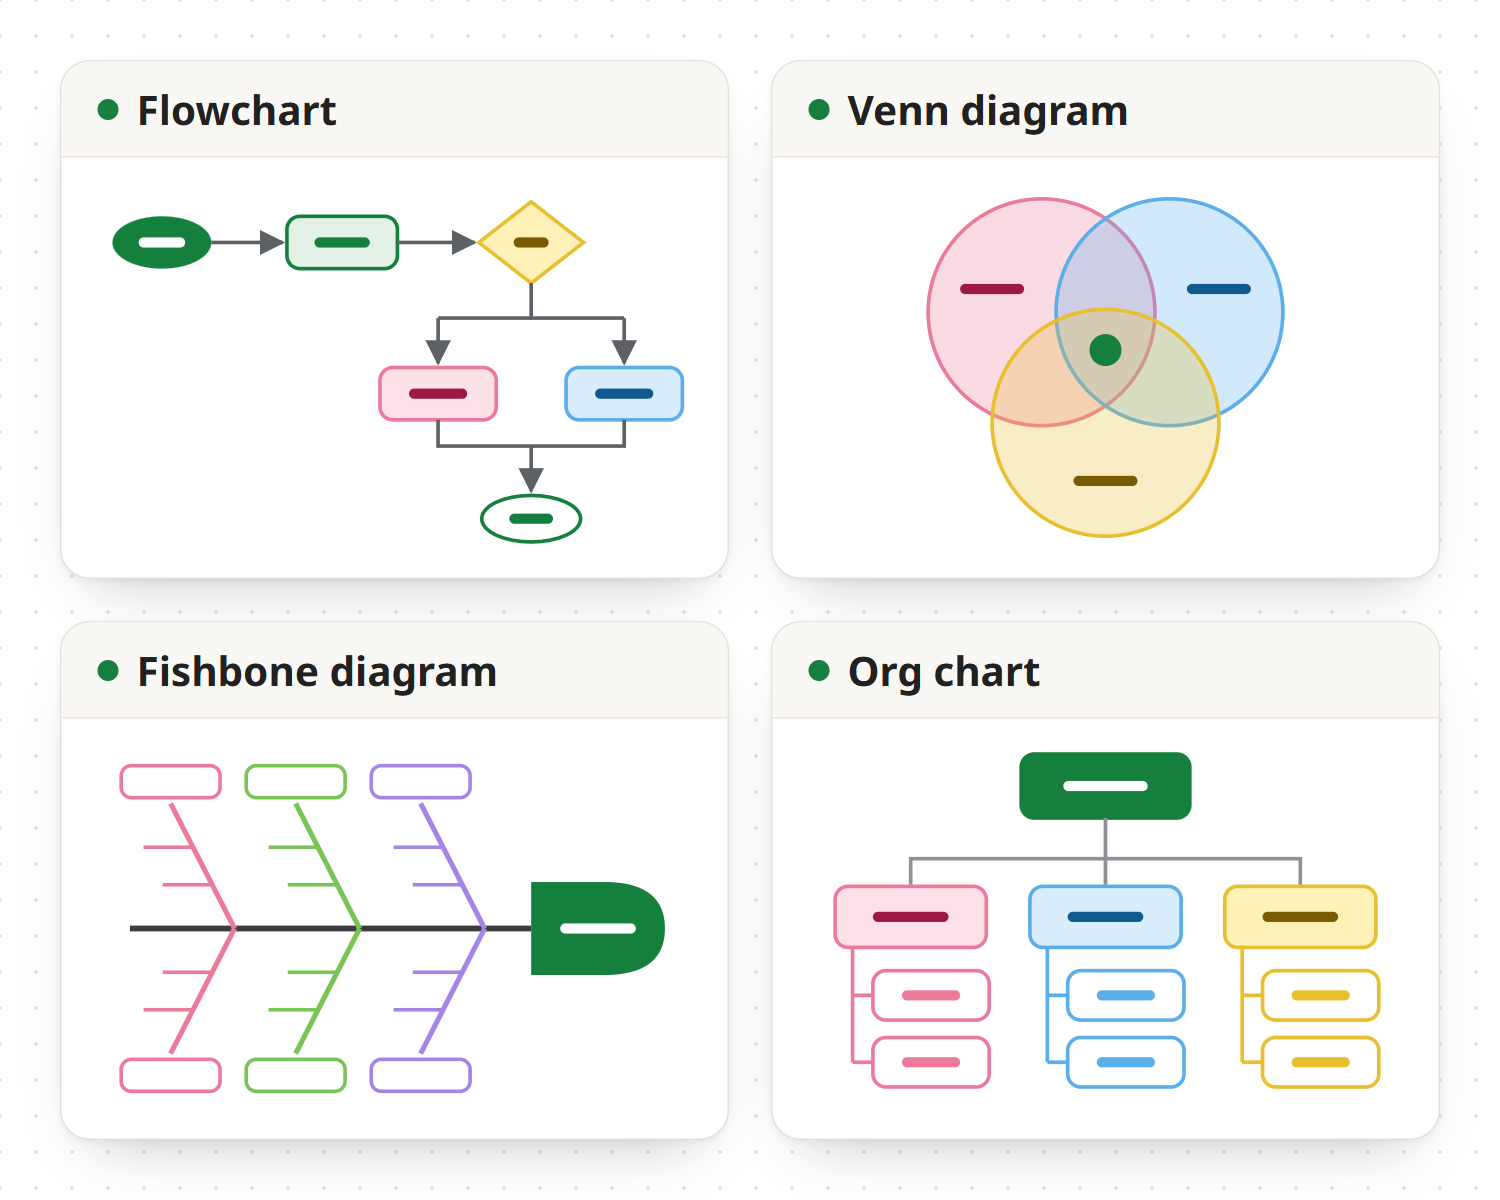
All 15 templates at a glance:
Process diagram templates
Process diagrams put steps in order, so everyone follows the same path and gaps show up before they cost anything.
Flowchart template
A flowchart shows a process as a sequence of steps, with a diamond wherever the process branches on a decision. This template has three rows of steps to fill in, decision diamonds, ovals, notes beside the steps, and brackets that sum up the outcomes of a branch. Use it to document how a process runs today, or to design a new one before you build it. More on how flowcharts work. Frank and Lillian Gilbreth presented the first “flow process charts” to the American Society of Mechanical Engineers in 1921; the shapes used today were standardized in ISO 5807 in 1985.

Cycle diagram template
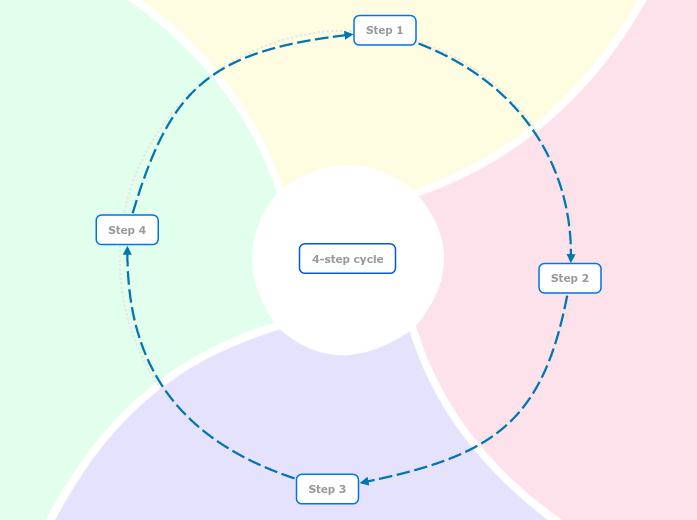
For a process that ends where it starts: plan, do, check, act; a product’s life cycle; a study routine you repeat every week. Four steps sit on a clockwise loop around the name of the cycle. If your cycle has more stages, start from the 5-step or 6-step cycle instead. The plan-do-check-act loop goes back to Walter Shewhart’s quality-control cycle of 1939, which W. Edwards Deming took to Japanese industry in the 1950s.
Timeline template
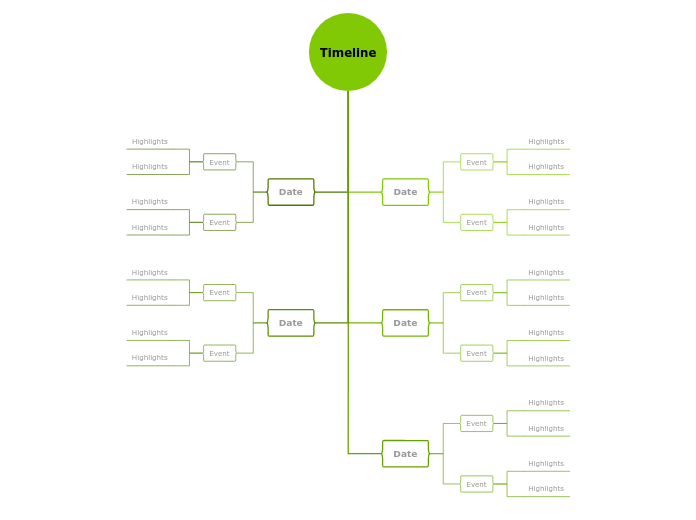
A vertical line with five dates, alternating left and right, two events on each date and two highlights on each event. Use it for project milestones, a company’s history or a history lesson, and add dates as the story grows. To start from a blank one, choose Timeline in the Create menu of your dashboard. Read more about timeline diagrams. Joseph Priestley’s A Chart of Biography (1765), which drew about 2,000 lives as lines along a scale of years, was one of the first timelines of this kind.
Kanban board template
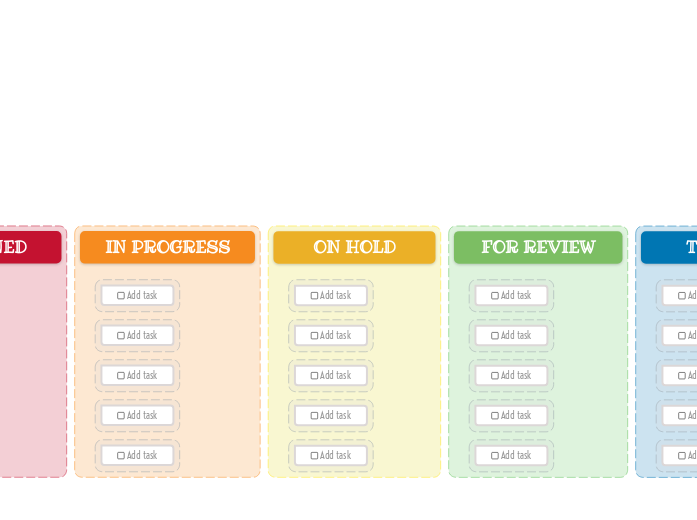
Seven columns, from New tasks through Assigned, In progress, On hold, For review and Testing to Done. Write each task on a card and move it one column to the right as the work advances, so the whole team sees at a glance what is waiting, what is stuck and what is finished. More on how to use a Kanban board. The method comes from Toyota, where kanban cards have signaled since the 1950s that a station needs more parts (Toyota Production System); David J. Anderson adapted it for software teams in Kanban (2010).
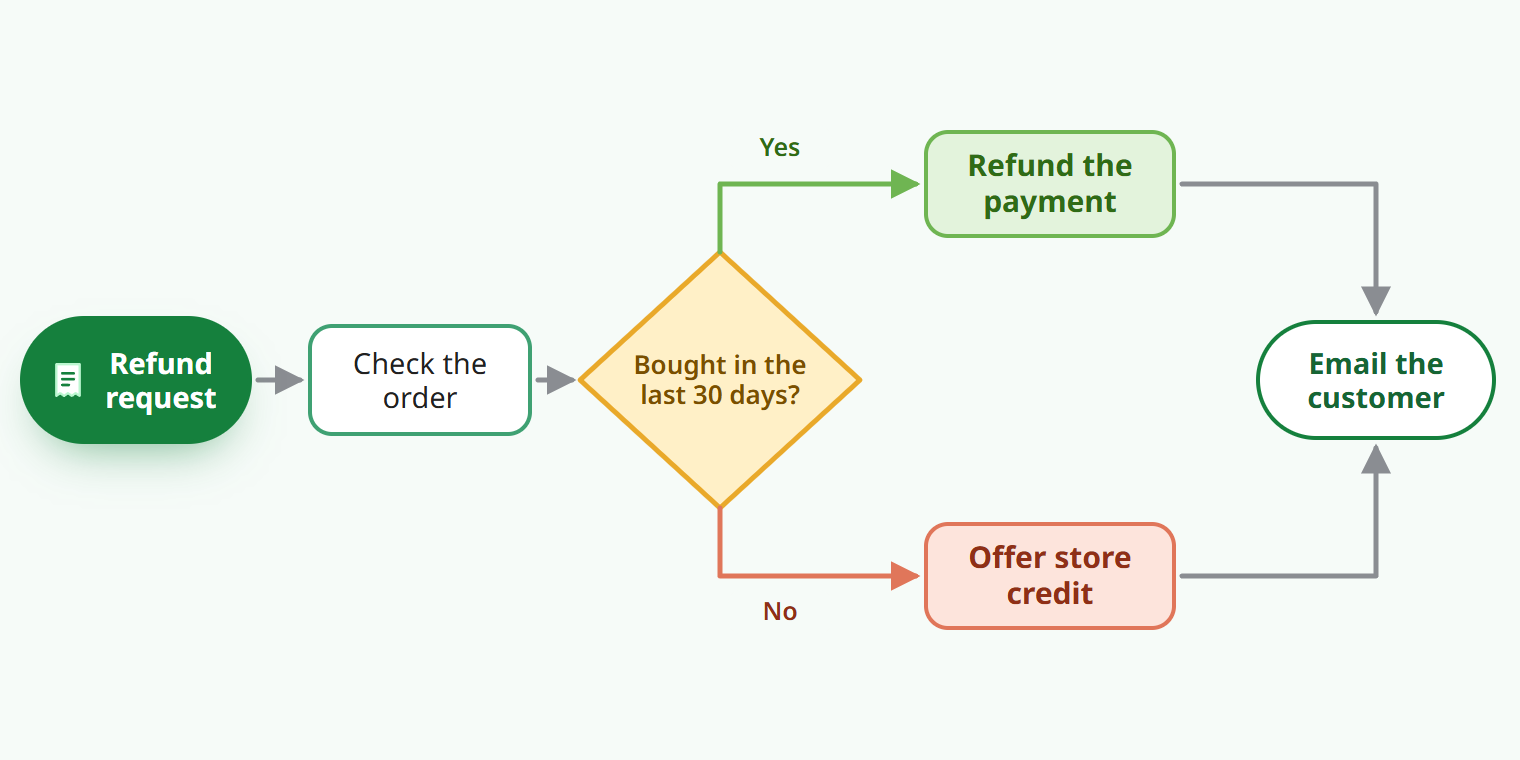
Example: a refund process as a flowchart
A shop’s refund rule, filled into the flowchart’s shapes. The request starts the process, one decision checks when the order was placed, and both answers end in an email to the customer, so no request goes unanswered. The rule fits in one diamond because it asks one question with two answers; a second condition, such as the state of the item, would be a second diamond.
Tip
Common mistake: steps at different levels of detail, such as “Ship the order” next to “Click Save”. Keep every step at the same level, ask one question in each diamond and label both its answers. If nothing branches, a numbered list is enough; if the steps have dates and depend on each other, a Gantt chart shows them better.
Comparison diagram templates
Comparison diagrams put two or three things side by side, so the similarities and the differences are both on the page.
Venn diagram template
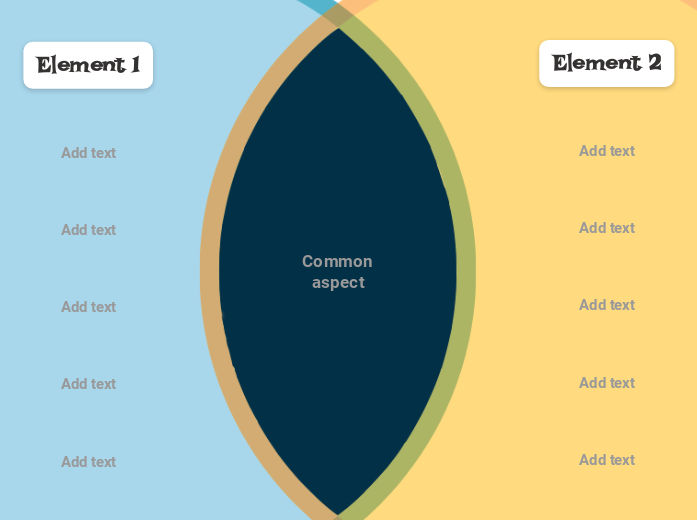
Two overlapping circles, each with five fields, and the overlap for what both share. Students use it to compare two characters, two countries or two periods; teams use it to compare two tools or two offers before they choose. More on what a Venn diagram shows. John Venn introduced the diagram in 1880, in “On the diagrammatic and mechanical representation of propositions and reasonings”.
3-circle Venn diagram template
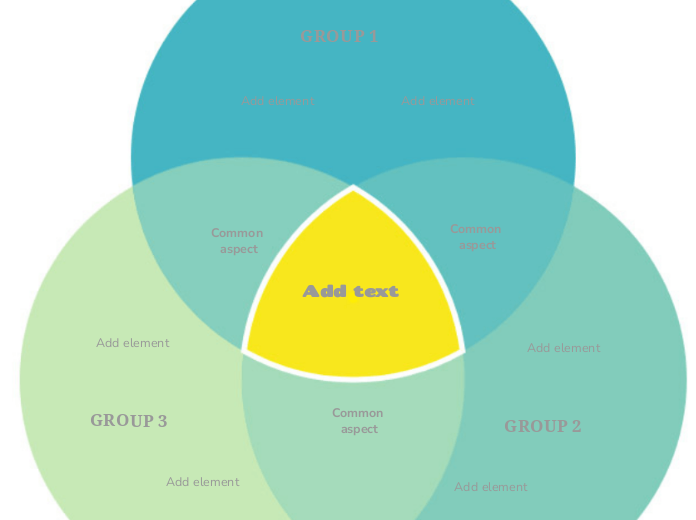
Three groups, a field for each overlap of two, and a yellow center for what all three have in common. It suits questions with three sides: three products, three candidates, three historical figures. See 10 Venn diagram examples for ideas. Venn already drew three circles in that 1880 paper. Three is the most that circles can show with every overlap, which is why he switched to ellipses for four.
T-chart template
Two columns under a T-shaped divider, six fields in each. Give the columns opposite headings, such as pros and cons, facts and opinions, or before and after, and fill them in one row at a time. More on using T-charts. Benjamin Franklin described the method in a letter to Joseph Priestley in 1772: reasons for on one side, reasons against on the other, and items of equal weight struck out on both.

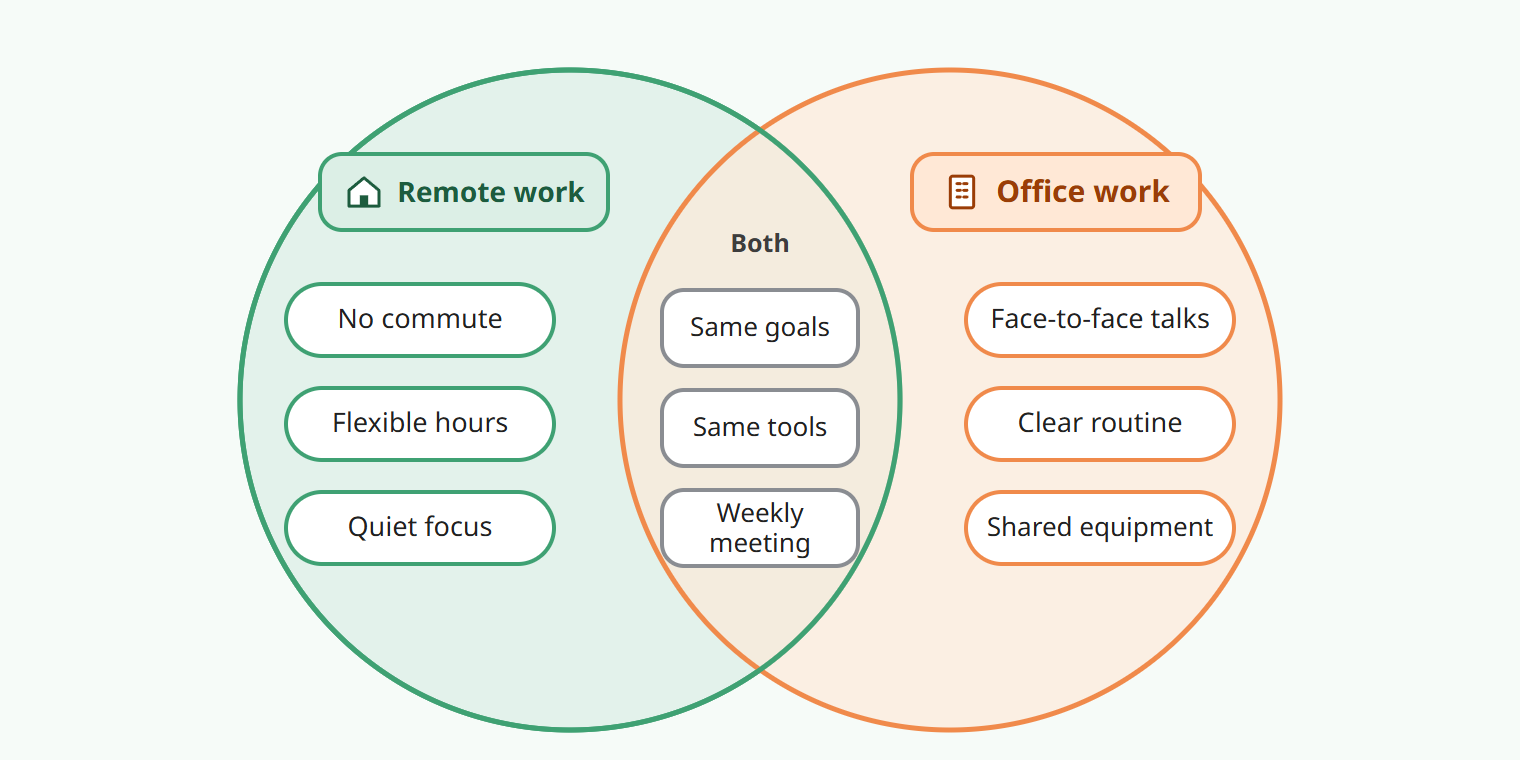
Example: remote and office work in a Venn diagram
A team choosing a hybrid policy lists what each way of working gives it. The overlap holds what the team keeps whichever it chooses (the same goals, the same tools, the weekly meeting), and each side shows what it would give up. The decision then comes down to the six items outside the overlap.
Tip
Common mistake: putting in the overlap what is only similar. An item belongs in the middle only if it is true of both sides as written; otherwise it goes on one side. Past three circles a Venn diagram stops being readable: to compare four or more things, use a table.
Decision and strategy diagram templates
These templates lay the options and what each one leads to on one page, so a choice can be argued from the same picture.
Decision tree template
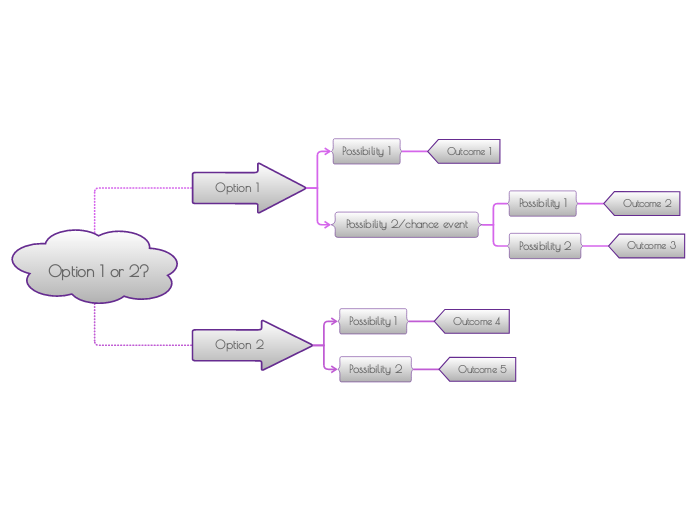
The question sits on the left and branches into two options, each into the possibilities it opens, and every path ends in an outcome. One branch has a chance event, for what you cannot control. Write a probability or a cost on each branch and compare the outcomes at the end. More on how decision trees work, with examples. Decision trees became a standard tool for business decisions with Howard Raiffa’s Decision Analysis (1968), which drew decisions as squares and chance events as circles.
Impact vs. effort matrix template
Sorts a to-do list into four groups: quick wins (low effort, high impact), major projects (high effort, high impact), fill-ins (low effort, low impact) and tasks not worth it (high effort, low impact). Do the quick wins first, plan the major projects, and drop or delegate the rest. It is a 2×2 prioritization grid, the same shape as the urgent-important matrix Stephen Covey made popular in The 7 Habits of Highly Effective People (1989).

SWOT analysis template
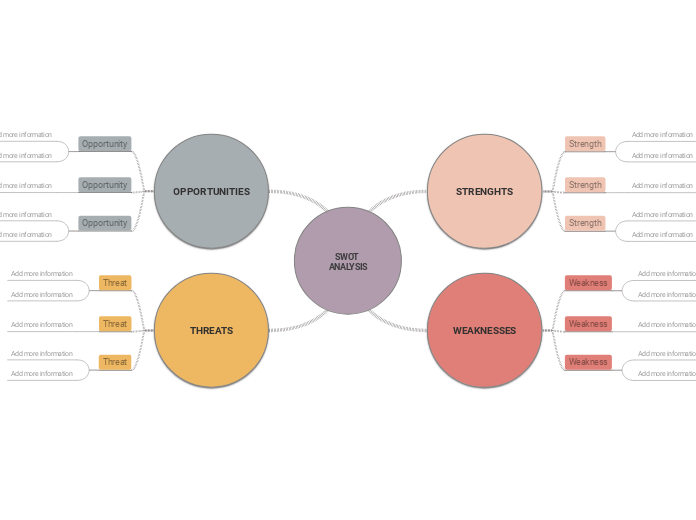
Strengths, weaknesses, opportunities and threats in four circles around the subject, with three items in each and room for the evidence behind them. Fill in the strengths and weaknesses from inside the organization, the opportunities and threats from outside it, then turn them into a plan with the strategy from SWOT analysis template. SWOT took shape in the 1960s in the business policy course at Harvard Business School, set out in Business Policy: Text and Cases (Learned, Christensen, Andrews and Guth, 1965).
Example: where to hold the summer party
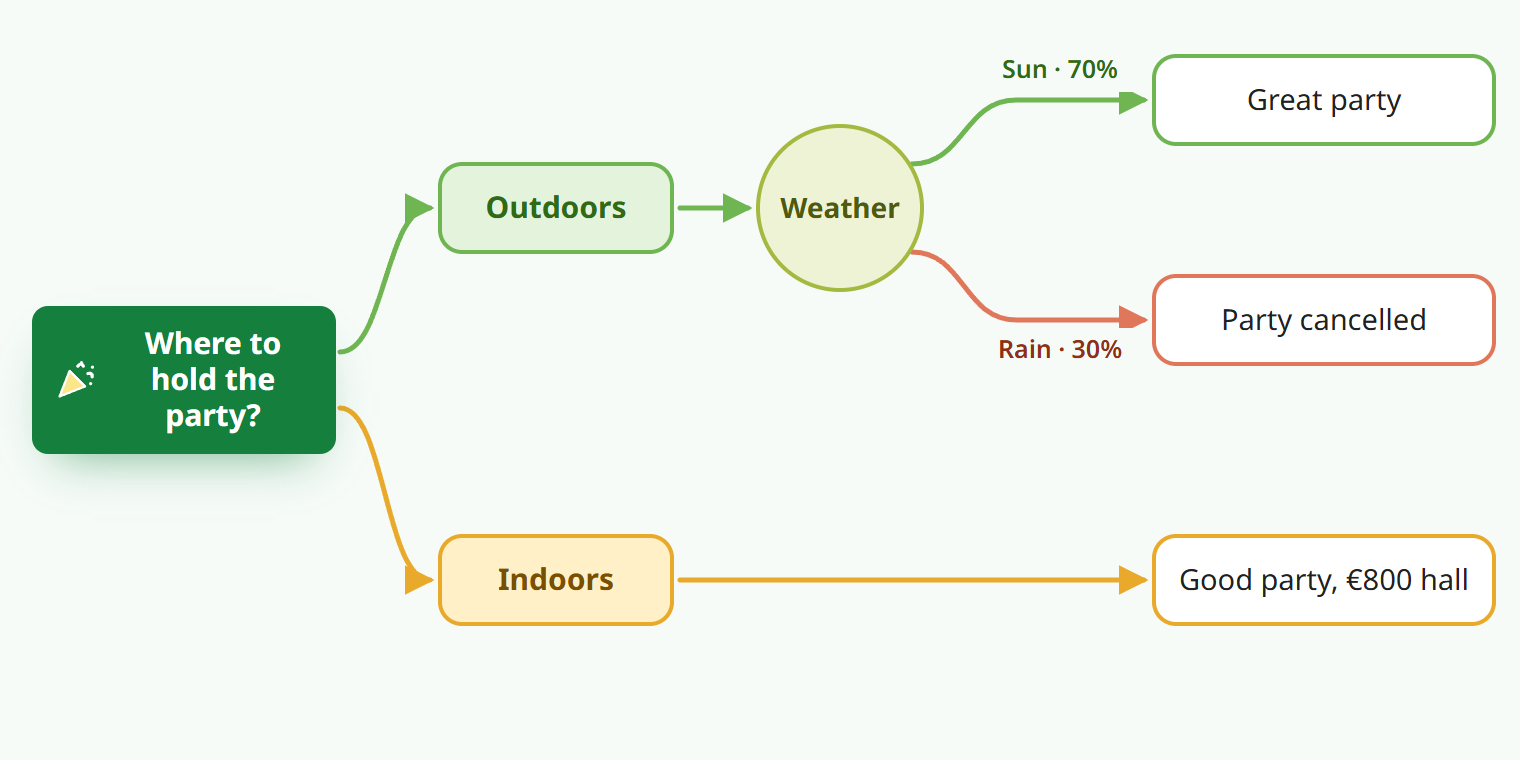
The question is the first node, and each option is a branch. Outdoors depends on the weather, a chance event the team can’t control, so its branches carry probabilities: 70% sun, 30% rain. Indoors has a known cost, an €800 hall. With almost one chance in three of losing the party, the hall is the safer choice, and the tree makes that trade-off visible to everyone.
Tip
Common mistake: leaving out the option of doing nothing, or of waiting. Add it as a branch, so every other option has to beat it. At each chance event the probabilities should add up to 100%; note where each number comes from, so the team argues about the inputs rather than the conclusion.
Cause-and-effect diagram templates
When something goes wrong, these templates help a team list every possible cause before it settles on one.
Fishbone diagram template
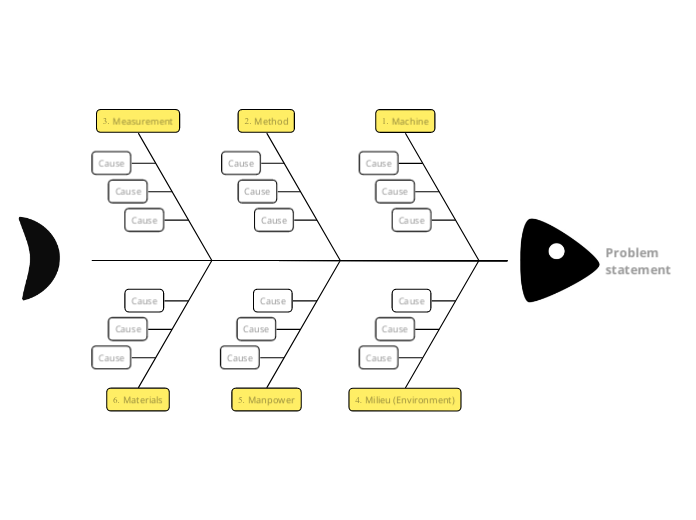
Also called an Ishikawa or cause-and-effect diagram. The problem goes at the head, and the bones hold the 6M categories of causes: machine, method, measurement, milieu (the environment), manpower and materials, with three causes on each. Brainstorm causes under every category, then pick the likeliest ones to test. Fishbone is also a layout in the Create menu. More fishbone diagram templates. Kaoru Ishikawa drew the first one in 1943, to show engineers at the Kawasaki steel works how many factors lay behind a quality problem; it became one of the seven basic tools of quality.
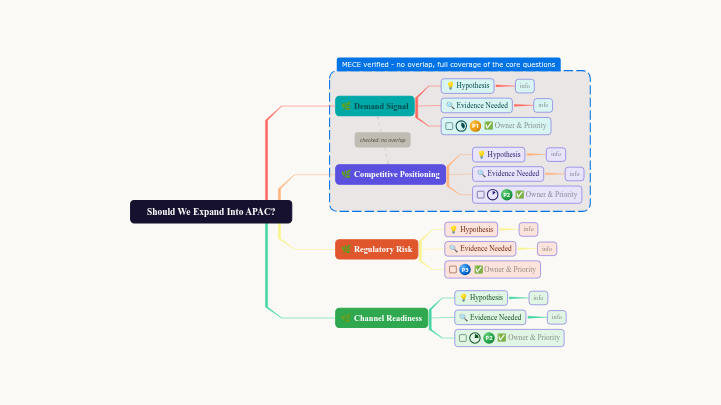
Issue tree template
The consultant’s way to break a big question into smaller ones. The example asks “Should we expand into APAC?” and splits it into four questions, each with a hypothesis, the evidence needed to test it, and a task with an owner and a priority. A note checks that the branches do not overlap and together cover the whole question. Replace the example with your own question and keep the structure. The note’s no-overlap, full-coverage test is the MECE rule (mutually exclusive, collectively exhaustive), which Barbara Minto taught at McKinsey and set out in The Pyramid Principle.
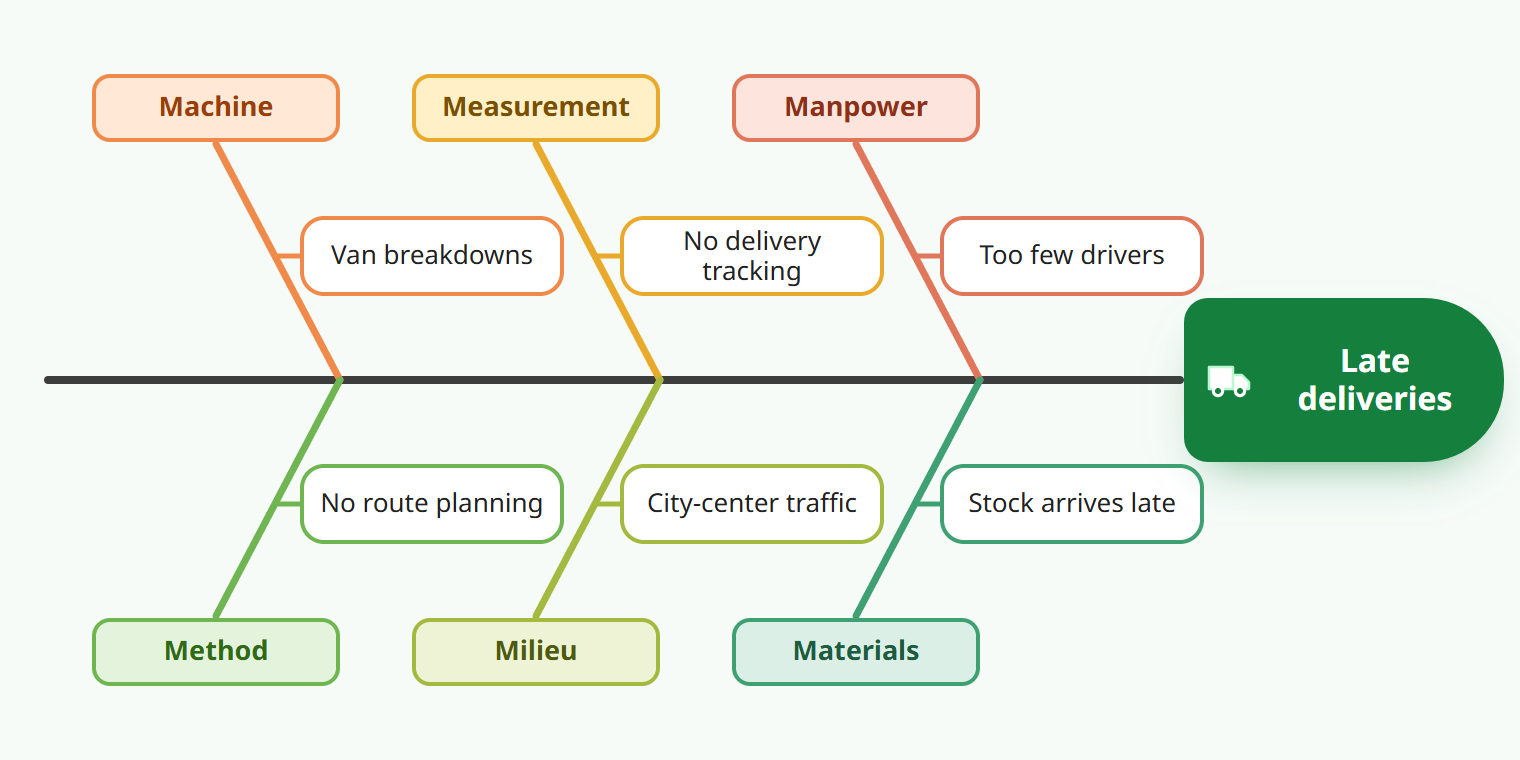
Example: why deliveries arrive late
A delivery team’s fishbone, with one cause on each of the six bones. Every cause on it can be checked against data: the vans’ service log, the planned routes, the tracking records. The team tests those first, before it settles on the cause the loudest voice in the room suggested.
Tip
Common mistake: writing symptoms as causes. “Customers complain” restates the problem; keep asking “why?” until you reach something you can check or change. The diagram lists possible causes, not proven ones, so test the likeliest before you fix anything. When the cause is already known, skip the fishbone and plan the fix.
Hierarchy diagram templates
Tree-shaped diagrams show who or what sits above whom, from one root down.
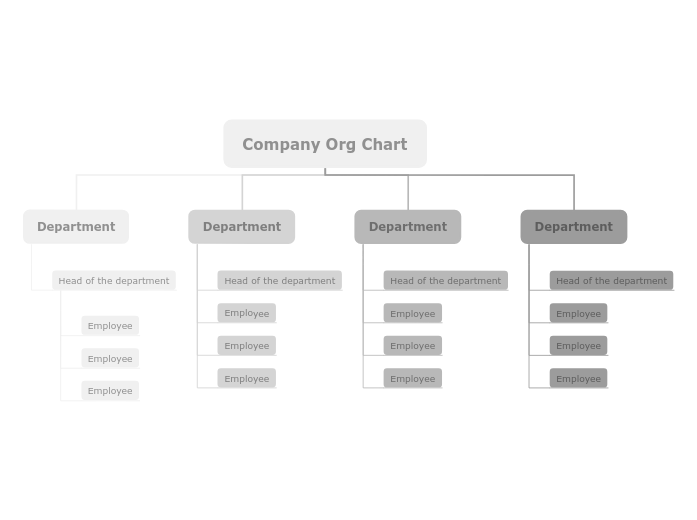
Org chart template
Four departments under the company, each with its head and three employees. Rename the departments, add or remove people, and put each role’s responsibilities in a note on its box. To start from a blank chart, choose Organigram in the Create menu. See 5 organizational chart examples. The oldest known org chart was drawn up in 1855 for the New York and Erie Railroad by its superintendent, Daniel McCallum; the Library of Congress holds a copy.
Family tree template
Four generations drawn on a tree: you at the trunk, then your parents, four grandparents and eight great-grandparents in the branches. Add photos, dates and stories to each person. For a plainer layout that grows further back, use the genealogy chart template. Families have been drawn as trees for centuries: medieval artists painted the Tree of Jesse, the ancestry of Christ, growing out of the sleeping Jesse.

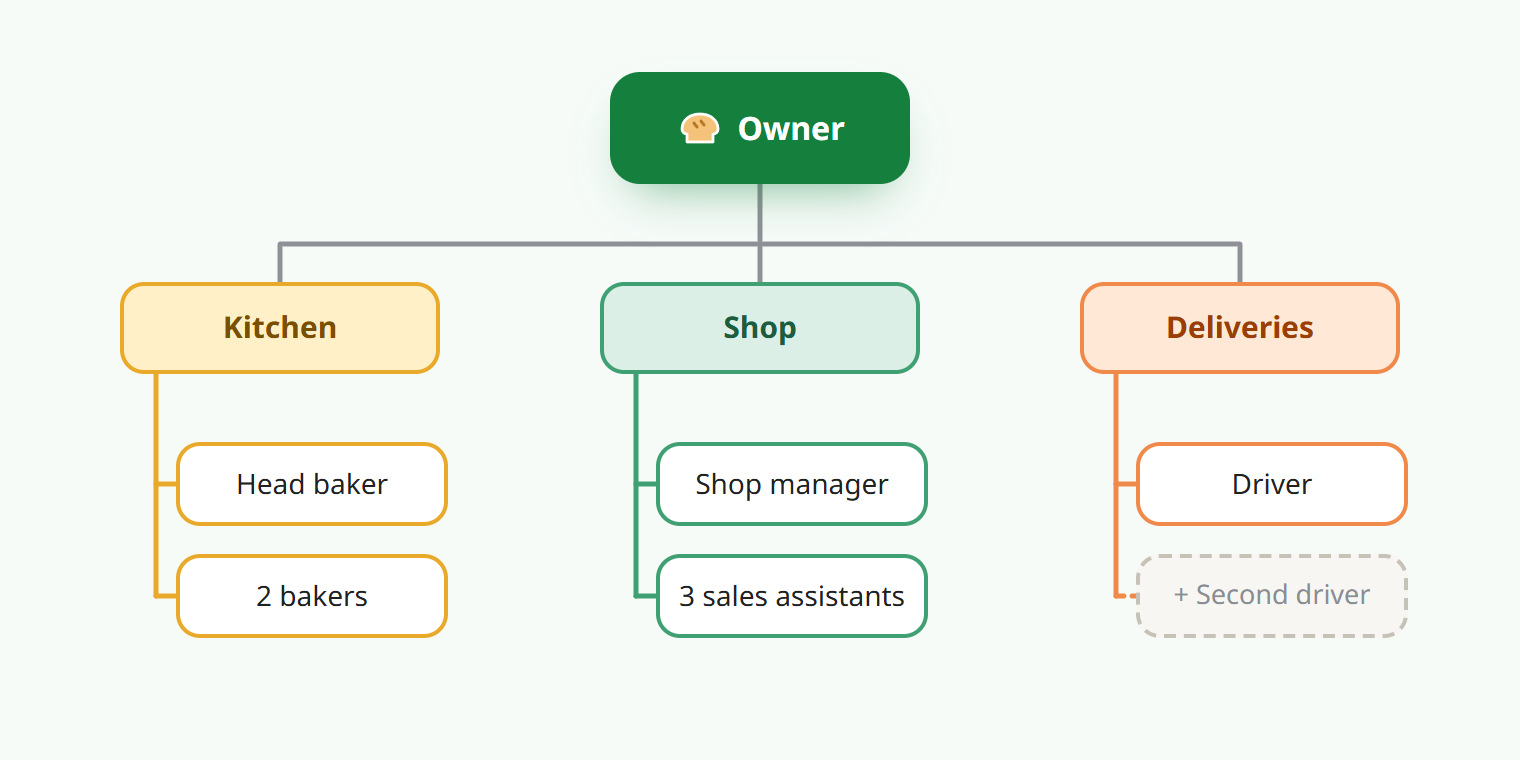
Example: a bakery’s org chart
A bakery with nine people: the owner at the top, three teams below, and the roles in each team under it. A new employee sees at once who to ask about an order. The chart also shows a risk: deliveries rest on a single driver, so the dashed box is the next hire.
Tip
Common mistake: charting names instead of roles. Write the role in each box and the person’s name in its notes, so the chart still holds after the next hire. A tree gives each person one manager: if someone reports to two, draw the second line as a dashed relationship or add a note.
Concept map and mind map templates
Two diagrams show how ideas relate rather than steps or ranks. A concept map labels every link, so each pair of ideas reads as a statement. A mind map branches out from one topic without labels, which makes it quicker for brainstorming and notes.
Concept map template
A central topic, five concepts, a label waiting on every arrow and one cross-link between two branches. Write the question the map should answer in the center, then give each arrow a short verb such as “causes” or “includes”. The concept map templates page has six more, for biology, the water cycle, a research project and more. Joseph Novak and his team at Cornell University developed concept maps in 1972, to follow how children’s understanding of science changed (Novak and Cañas, IHMC).

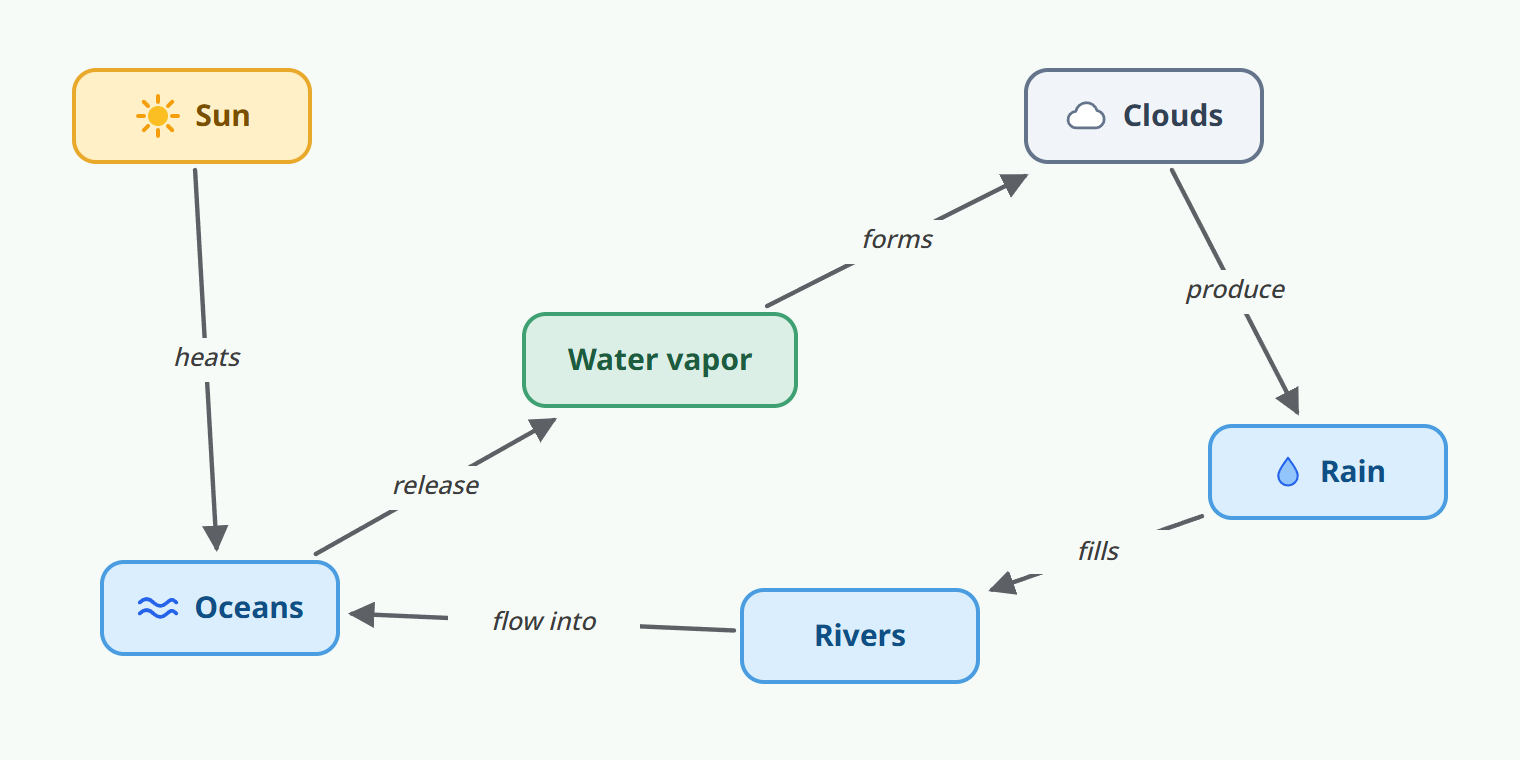
Example: the water cycle as a concept map
Six concepts and a verb on every arrow. Read along the arrows and each link is a sentence: the sun heats the oceans, the oceans release water vapor, water vapor forms clouds, clouds produce rain, rain fills rivers, and rivers flow into the oceans, which closes the cycle.
For mind maps, see our mind map examples and templates: interview preparation, book summaries, meeting plans, a personal SWOT analysis and more, each ready to copy.
Tip
Common mistake: arrows without words. “Sun → oceans” states nothing; “the sun heats the oceans” is a claim a reader can check. If you only need to collect ideas around one topic and the links don’t need explaining, a mind map is quicker.
Diagram types at a glance
The 15 templates on this page, with what each one shows and when it is the one to use:
| Template | What it shows | Best for |
|---|---|---|
| Flowchart | Steps and decisions in order | Documenting or designing a process |
| Cycle diagram | Steps that repeat | Routines, plan-do-check-act, life cycles |
| Timeline | Events in date order | Milestones, histories, lessons |
| Kanban board | Work moving through stages | Following a team’s tasks |
| Venn diagram | What two groups share, and what not | Comparing two options |
| 3-circle Venn diagram | What three groups share | Three-way comparisons |
| T-chart | Two lists side by side | Pros and cons, before and after |
| Decision tree | Options, chances and outcomes | Choices with uncertain results |
| Impact vs. effort matrix | Tasks by payoff and cost | Prioritizing a to-do list |
| SWOT analysis | Internal and external factors | Reviewing a strategy |
| Fishbone diagram | Possible causes of one problem | Finding a root cause as a team |
| Issue tree | A question split into smaller ones | Structuring an analysis |
| Org chart | Who reports to whom | Teams and companies |
| Family tree | A family’s generations | Genealogy, school projects |
| Concept map | How ideas relate, in labeled links | Explaining how something works |
How to use a diagram template
-
Copy the template.
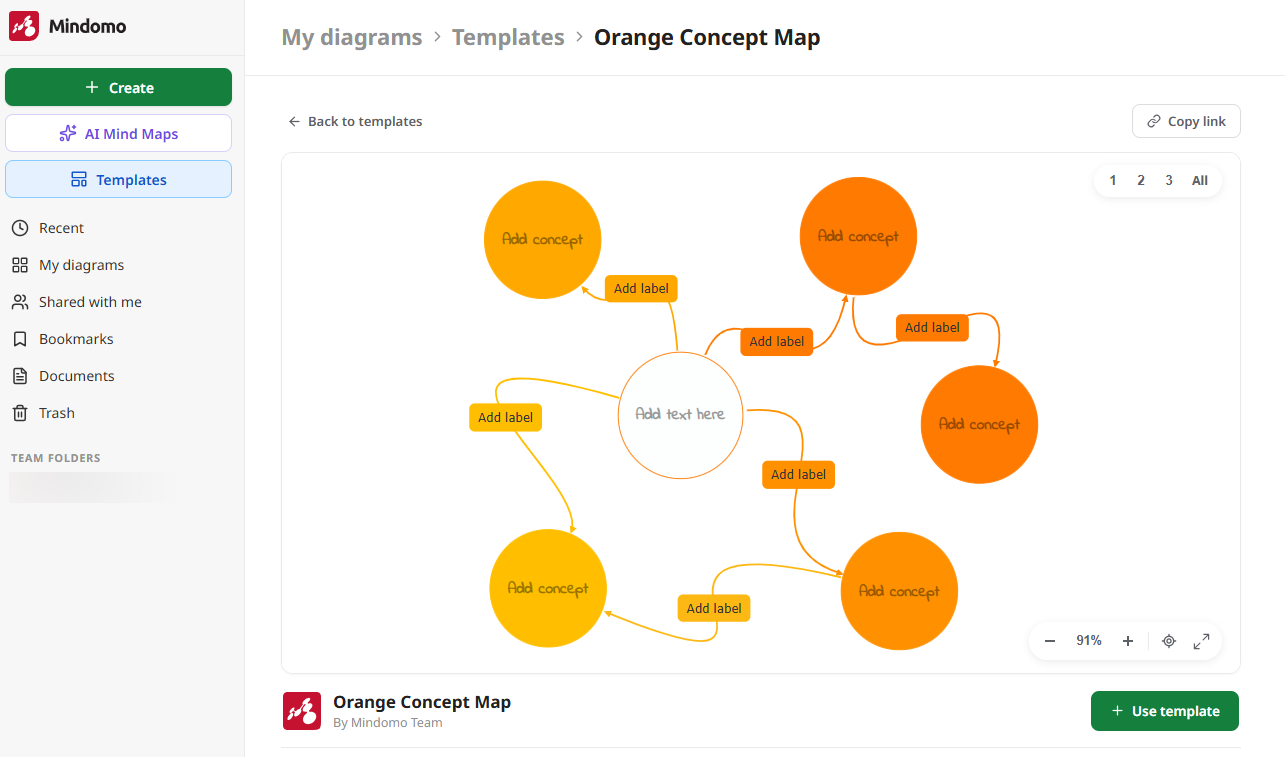
Click the Use the … template button under any template above. The template gallery opens on that template; click Use template beside the preview to create your own copy. You can also find every template under Templates on your dashboard.
-
Replace the placeholders.
Click any “Add text” field and type your own content. Add, delete or move shapes until the diagram covers your subject.
-
Add detail.
Select a shape and click + above it to add notes, links, images, icons or a comment, so the diagram stays short and the detail is one click away.
-
Style it.
Change the colors, shapes and fonts of single shapes, or restyle the whole diagram from the Style panel.
-
Share or export it.
Select Share to invite others to edit it with you, or present it straight from Mindomo. The free plan exports to Mindomo and text files; paid plans add PDF, Word and image, for a printable copy.
Tip
Copy the template once for each new diagram, and keep your own edited version as a starting point for the next one: the structure your team agreed on is the part worth reusing.
Make diagrams together
Mindomo runs in the browser, on the desktop and on phones, so a diagram you copied can go straight to the people who will work on it.
- Real-time editing: everyone you share it with edits the same diagram and sees each change as it is made.
- Comments and chat: discuss a single shape in its comments, or the whole diagram in the chat.
- Playback: replay how the diagram was built, with each person’s changes in their own color.
Every diagram stays private until you share it. A mind map or concept map can also switch views in one click: to a concept map or mind map, to an outline, and, on the Professional, Team and Business plans, to a Gantt chart.
Diagram template FAQ
Are these diagram templates free?
Yes. All 15 are free to copy and edit. The free plan includes 3 maps, so you can work on any three at no cost; for more, choose a premium subscription.
Can I print a diagram template?
Yes: copy it, fill it in, then export it as a PDF or an image and print it. PDF and image export need a paid plan; copying and editing a template is free.
Can I make a diagram from scratch instead?
Yes. Select Create on your dashboard and choose a blank mind map, concept map, organigram, timeline, fishbone diagram or outline. Gantt charts are included in the Professional, Team and Business plans.
Can several people edit the same diagram?
Yes. Share it, and everyone with edit access works on it at the same time and sees the others’ changes as they happen. Comments, chat and playback keep track of the discussion and of who changed what.
Where can I find more diagram templates?
In the Mindomo template library, grouped by use: quick diagrams, planning, business analysis, project management, school subjects and more.