Top 5 Gantt Chart Software in 2026
1. Mindomo
⭐Best for: Teams, educators, project managers, and individuals who want both structured planning and creative thinking in one affordable tool.
💰Pricing: It offers a completely free plan, and it has affordable Premium, Team, and Business plans (starting from 6€/user/month).
-
Premium Plan: 6€/user/month (billed annually): includes mind maps, concept maps, timelines, logic charts, fishbone diagrams, outlines, offline editing, task management, import/export, basic collaboration tools, and cloud storage sync.
-
Team Plan: 6€/user/month (annually, minimum 3 users): adds Gantt charts, shared team folders, real-time collaboration, content backup, centralized admin dashboard, and integration with Microsoft Teams, Google Drive, OneDrive, and Dropbox, backups, and more.
-
Business Plan: 10€/user/month: includes Gantt charts, advanced sharing permissions, guest editing, priority support, advanced security, SAML SSO, etc.
💻Platforms: Web, Desktop (Windows and macOS), mobile (iOS and Android).
Mindomo stands out as the only tool in this ranking that seamlessly combines mind mapping with Gantt chart scheduling, and collaborative task management in one intuitive platform. While most Gantt tools focus solely on structure and timelines, Mindomo bridges the gap between visual brainstorming and execution planning, allowing users to turn ideas into action in just a few clicks.
Unlike many traditional project management tools that feel overwhelming or overly technical, Mindomo is refreshingly easy to use and anyone can jump in without training.
What makes it so powerful? Every project starts with an idea. With Mindomo, you can brainstorm freely, capture and organize your thoughts as mind maps (read more about what is a mind map here), then instantly turn those ideas into actionable tasks and organize them in categories. Once you have a clear structure you can transform the mind map diagram into a Gantt chart with one click. You can switch views to Outline as well. From there, it’s just a matter of planning, assigning, and scheduling tasks.

As your team works, you can track everyone’s progress in real time, get notified about deadlines, and always stay one step ahead with a clear visual overview of who’s doing what, all in one seamless workspace.
This ability to support every stage of a project, from initial brainstorming to task execution and progress tracking, is exactly why Mindomo ranks as the best Gantt chart software of 2026. Even though Mindomo isn’t a traditional project management suite at its core (its primary strength is to be a mind map maker), it offers all essential Gantt chart features and a collaborative workspace through its Team and Business plans, making it a highly capable visual-first solution for managing projects from start to finish.
Key Features:
✅ Seamlessly switch between mind map, Gantt chart, and outline view: all fully synced and instantly updated.
✅ Built-in task management: deadlines, recurring tasks, priorities, assignees, completion tracking, and notifications.
✅ Real-time collaboration: co-editing, comments, chat, and premium sharing options.
✅ Templates for projects, meetings, plans, and more + Customizable templates.
✅ Cross-platform access: Web, Windows, macOS, iOS, Android, with offline editing on Desktop (including Local-only Desktop: full functionality without Cloud connection) and mobile apps.
✅ Easy learning and simple interface.
✅ Integrations: connect with Microsoft Teams, Google Workspace, OneDrive, Dropbox, and more.
✅ Sync with external calendars like Google Calendar, Microsoft Outlook, and more.
✅ 20+ Export formats (PDF, Excel, CSV, etc.), file attachments, multiple links on topics, interactive comments, notes, etc.
✅ Enterprise-ready: SAML SSO, API access, admin controls, backups, and team spaces
✅ Beyond Gantt charts: build mind maps, concept maps, outlines, fishbone diagrams, timelines, logic trees, and more.
2. Smartsheet
⭐Best for: Mid‑sized to large teams and organizations that need spreadsheet-style flexibility, automation, dashboards, and robust reporting.
💰Pricing: It doesn’t offer a permanent free plan (30‑day trial only). It has Pro, Business, and Enterprise plans (starting from 9€/user/month).
-
Pro Plan: approximately 9€ /user/month (billed annually): includes up to 10 editors, grid/kanban/calendar/Gantt views, 250 automations/month, integrations with Microsoft 365, Google Workspace, Slack, Box, Dropbox.
-
Business Plan: around 19–25€ /user/month annually: adds unlimited automations, Timeline (enhanced Gantt), team workload tracking, 1 TB attachments, dashboards, admin features and enterprise integrations.
-
Enterprise: custom pricing with advanced governance, WorkApps, AI/insights, single-sign-on, and more.
💻Platforms: Web-based with iOS and Android mobile apps only.
Smartsheet is widely adopted in enterprises because it combines the familiarity of spreadsheets with the power of Gantt charts, automation, and dashboard reporting. According to organizations like Palfinger, the platform enabled standardization and collaboration across global teams with minimal effort using drag-and-drop interfaces and no-code automation. This makes it ideal for teams that manage many projects and need consistent reporting and integrations at scale.
However, while Smartsheet is powerful and flexible, it does come with a few trade-offs. Its spreadsheet-style interface can be overwhelming for new users, often requiring training or onboarding to use effectively. Performance may slow with large or complex sheets, and automation limits on lower-tier plans can restrict more advanced workflows. Pricing can also become a concern for growing teams, especially when scaling up to access premium features. While it’s excellent for structured planning, it offers limited support for more visual or creative approaches to project management.
Key features:
✅ Grid, Gantt, Kanban, Calendar & Timeline Views: manage projects in multiple formats with flexibility
✅ Advanced automation: alerts, approvals, update requests, triggers and more (up to 250 per user in Pro; unlimited in Business plan)
✅ Dashboards & Reporting: powerful templates, summary reports, and project/portfolio overviews for stakeholders
✅ Templates & WorkApps: standardized process templates and apps for workflows and governance
✅ Resource management: Basic workload and availability tracking tools for team planning
3. TeamGantt
⭐Best for: Small to mid-sized teams and project stakeholders who want a clean, focused Gantt chart experience and straightforward task collaboration.
💰Pricing: It offers a 14 days free plan only, and it offers paid plans (starting from 42€/user/month), which may be a significant investment for smaller teams or individual users.
-
Pro Plan: 42€/manager/month (billed annually) + 6€/collaborator/month: includes 20 projects per manager
-
Unlimited Everything: custom pricing (only available on yearly billing): it includes unlimited managers, collaborators and projects.
💻Platforms: Fully web-based; mobile apps for iOS and Android, but no Desktop app.
TeamGantt secured its spot as a top choice for teams seeking a straightforward, visually clear Gantt chart tool. Its user-friendly drag-and-drop interface makes scheduling and task management accessible, especially for small to mid-sized teams.
While it focuses primarily on Gantt charts and task collaboration, it offers enough flexibility to manage multiple projects efficiently without overwhelming users. This balance of simplicity and functionality makes TeamGantt a reliable option for streamlined project planning.
While TeamGantt excels in simplicity and ease of use, it may fall short for larger teams or more complex workflows. It lacks built-in budget or cost tracking, and fully leveraging advanced features like dependencies and resource allocation may require a bit of onboarding. Additionally, adding collaborators beyond the free tier involves extra cost, and manager accounts are relatively expensive, which can increase the overall investment for growing teams.
Key features:
✅ Drag-and-drop Gantt editor: easily adjust tasks, durations, and dependencies with a visual interface
✅ Multiple views: toggle between Gantt, calendar, list, and board formats
✅ Task comments & file attachments: collaborate directly within tasks
✅ Notifications and email reminders: help keep collaborators aligned
✅ Mobile apps: access project schedules and updates on iOS and Android
✅ PDF/CSV export for charts and reports
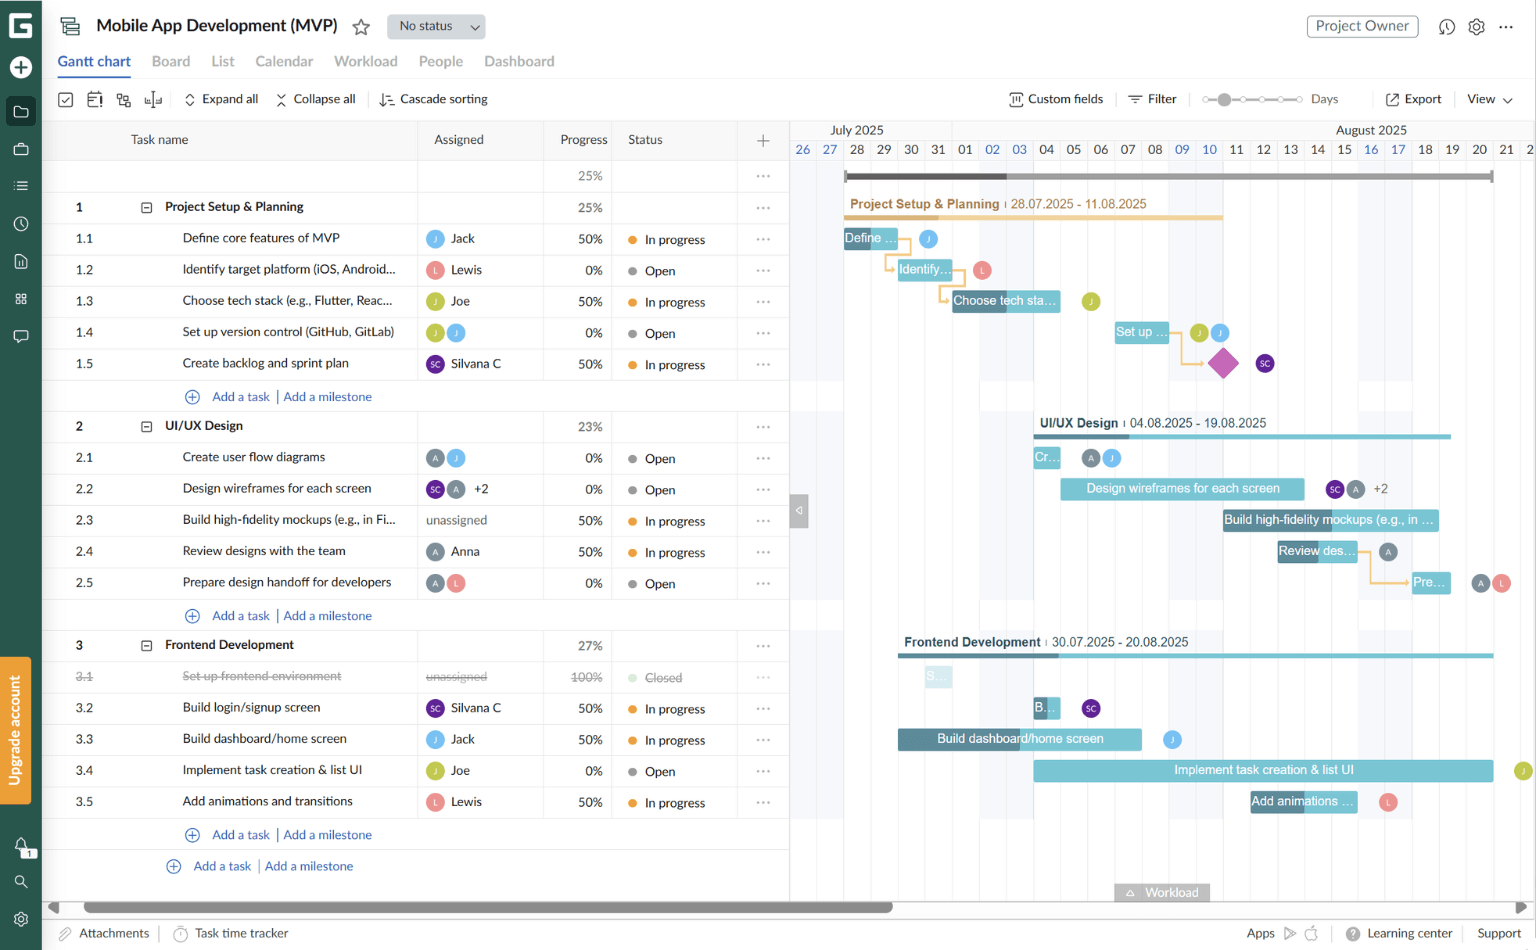
4. Wrike
⭐Best for: Medium to large teams and organizations needing advanced collaboration, portfolio reporting, and enterprise-grade security.
💰Pricing: Free 14-day trial; paid plans start at around 10€/user/month for Team, with Business around 24€/user/month. Higher tiers and add‑ons (such as automation, integrations, data governance) can significantly increase total cost.
-
Team Plan: 10€/manager/month (billed annually) for 2-15 users, unlimited projects, and 2GB storage/user, and more.
-
Business Plan: 24€/manager/month (billed annually) for 5-200 users, 200 automations/user/month, expanded storage (~5 GB/user), premium integrations, and more.
-
Enterprise & Pinnacle Plans: custom pricing for more security SAML, access roles, advanced reposring, and more.
💻Platforms: Web-based, mobile apps (iOS and Android), including offline support for Gantt charts.
Wrike secures a strong position thanks to its professional-grade task and project management, including powerful Gantt charts, automation, dashboards, and robust reporting. It’s well-regarded for handling complex portfolios across teams and departments, with a high degree of customization. This makes it a go-to for structured project management where visibility, controls, and scale matter.
However, this depth comes with a learning curve, teams often report that onboarding takes time, and fully leveraging Wrike’s capabilities may require dedicated setup and training resources.
Key features:
✅ Interactive Gantt charts & timeline views: full task dependencies, drag-and-drop editing, critical path support
✅ Multiple project views: choose between table (spreadsheet-like), board (Kanban), calendar, and workload visualizations.
✅ Resource and workload management: visualize team capacity and job roles (upgraded plans).
✅ Advanced automation & integrations (add-ons): supports thousands of automated actions and connectors (e.g. Jira, GitHub, Salesforce).
✅ Enterprise-level security: SAML SSO, two-factor authentication, custom access roles and audit reports.
✅ Dashboards & custom reporting: tailored dashboards, BI integration, and exportable reports.
5. GanttPRO
⭐Best for: Small to medium-sized teams, freelancers, and managers who want a clean, focused Gantt chart solution with solid project tracking.
💰Pricing: Offers a 14-day free trial (no credit card required). Paid plans starts from approximately 6.50 €/user/month.
-
Core Plan: around 7€/user/month (billed annually): it includes Gantt charts, task status, priority and progress, comments, attachments, and more.
-
Advanced Plan: around 10€/user/month (billed annually): it offers overdue tasks, project templates, and more.
-
Business Plan: around 17€/user/month (billed annually): it includes reports, workload view, API, and more.
-
Enterprise Plan: custom pricing is available on request, including custom roles, onboarding assistance, and more.
💻Platforms: Fully web-based with native mobile access (iOS and Android). Offline support is limited; most users rely on the web interface for full functionality.
GanttPRO stands out for delivering streamlined, intuitive Gantt-focused project planning without overwhelming features. With its drag‑and‑drop scheduling, task dependencies, and timeline sharing, it’s especially popular among R&D and engineering teams that need clarity and precision in project visualisation.
Key features:
✅ Interactive Gantt charts with drag‑and‑drop scheduling, task hierarchy, dependencies, milestones, and baselines.
✅ Task management: priorities, statuses, time logs, deadlines, progress tracking, and assignees.
✅ Workload view to monitor team availability and balance assignments (Business plan).
✅ Project templates and reusable structures for faster planning.
✅ Real-time collaboration with comments, mentions, file attachments, and notifications.
✅ Advanced sharing options, including public links and export to PDF/Excel.
✅ Role-based access and user permissions for secure project control.
Why use Mindomo as your Gantt chart software?
Since we made the TOP 5 list of the best Gantt chart software, we should analyze the number one choice: Mindomo.
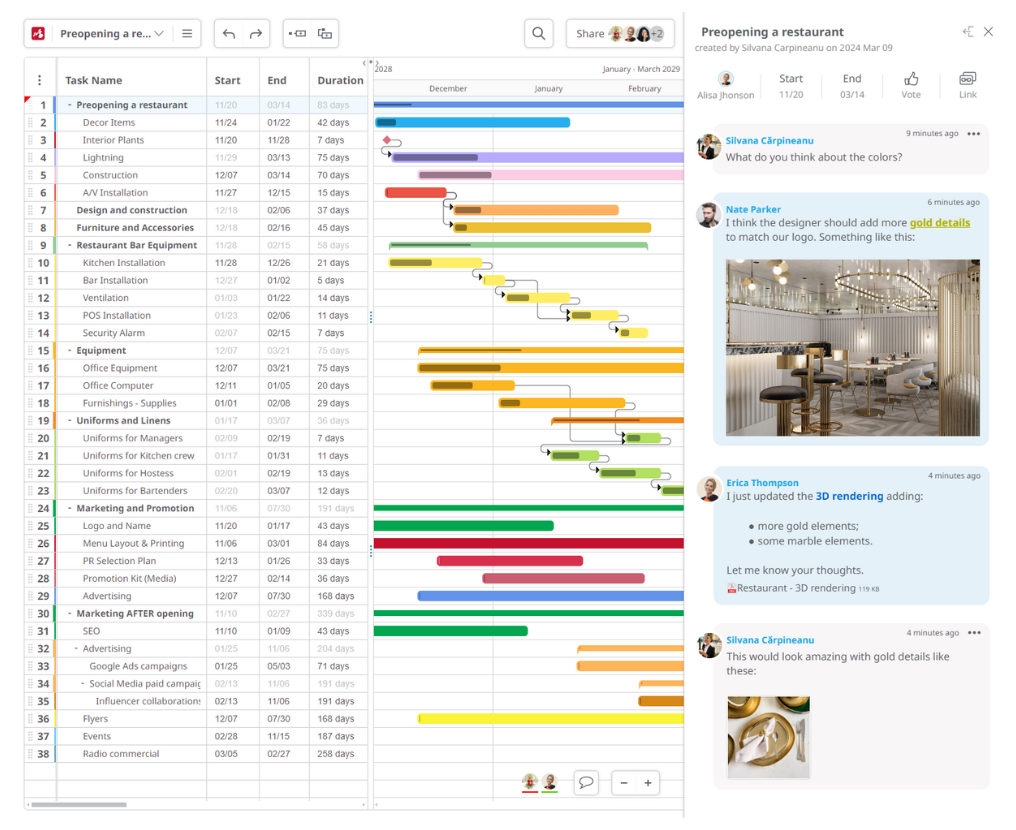
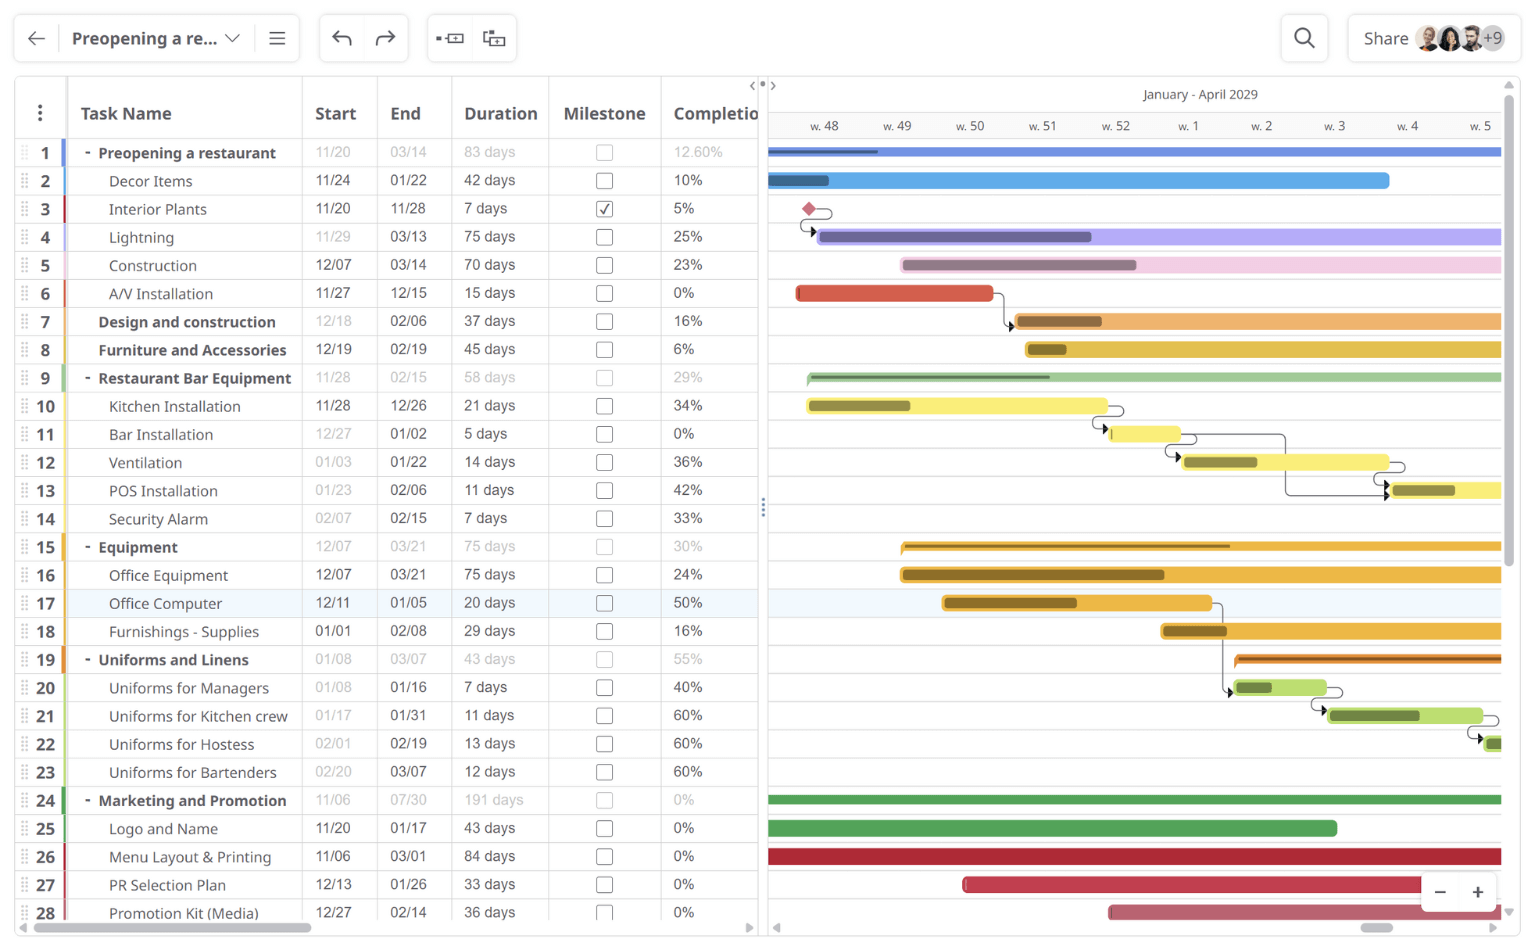
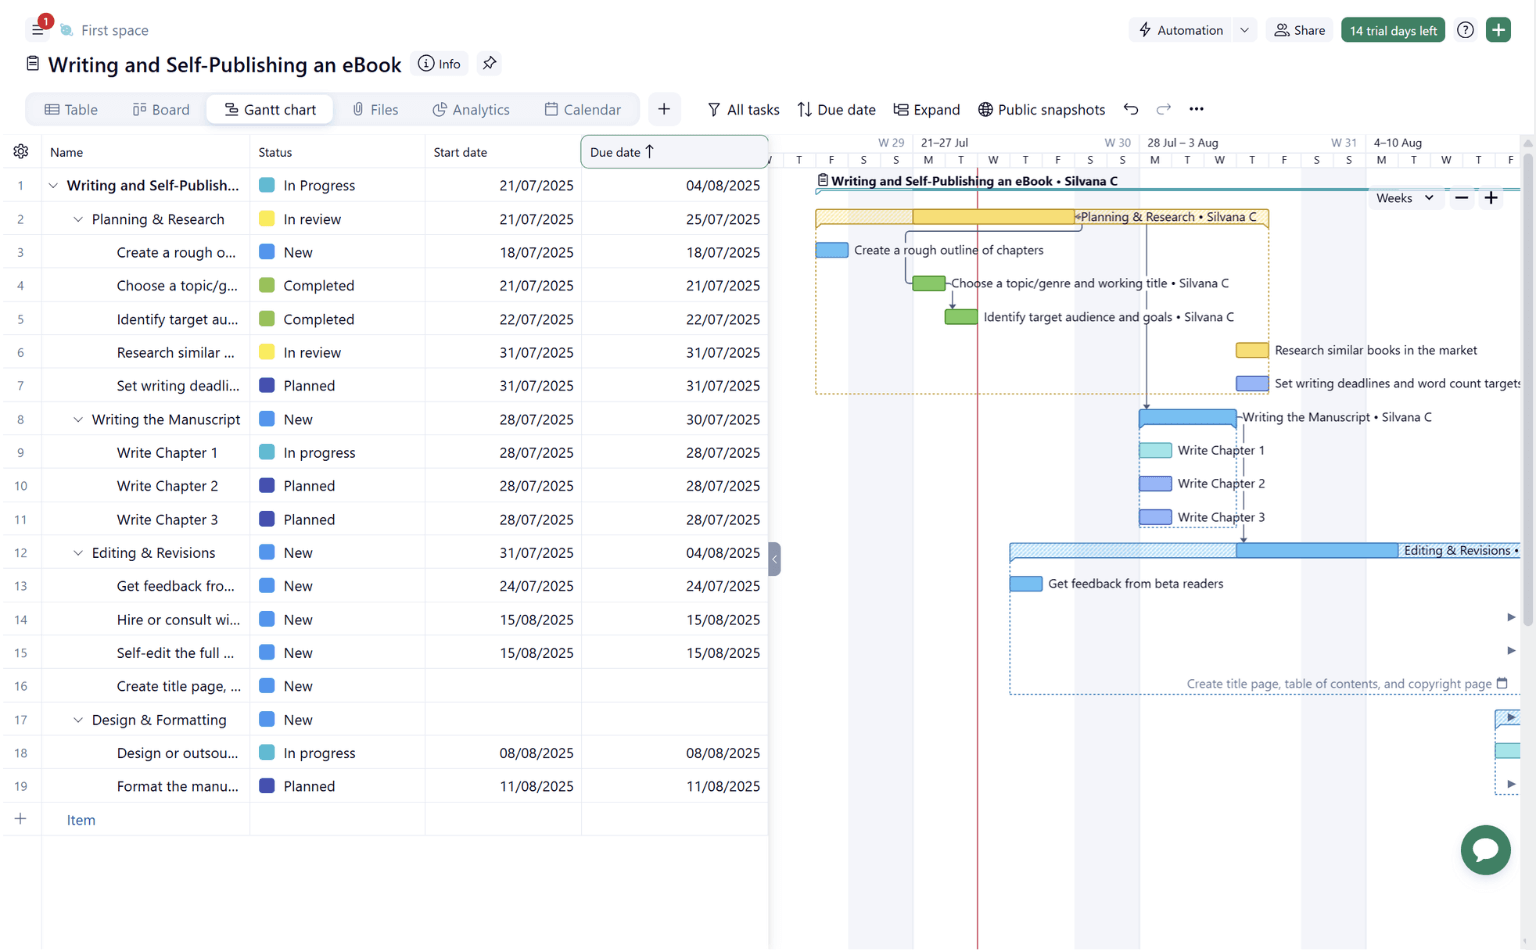
✓ Simple & Easy to use tool. Its power consists of simplicity: a simple solution to organize complex projects. Mindomo’s interface offers one clear side where you can add your tasks and all the necessary details and another side for a timeline that helps you visualize the upcoming activities in colorful bars, making it easier to track progress.
✓ Mindomo is more than a regular project management tool: You can instantly turn your Gantt files into mind maps or outlines, using the same diagram maker. Moreover, you can start planning your project in a mind map format (for example, do a brainstorming session) and then transform it into a Gantt framework with one click.
✓ Real-time collaborative Gantt chart maker: share and sync your work with any team member easily and immediately. In addition, you can work in Mindomo online (from any browser) or offline (Desktop app) and sync all the adjustments instantly.
✓ Suitable for complex projects: Mindomo’s Gantt chart includes all the tasks and milestones, an up-to-date timeline, the exact order of activities, completion and priorities levels, and the task assignees.
Discover how to create a Gantt chart with Mindomo in our easy step-by-step guide.
Structure your tasks: plan and schedule your activities
“How do you eat an elephant? One bite at a time.” As this popular quote says, to achieve it, you should divide a big goal into actionable steps.
You can add and move the tasks very easily by dragging and dropping them in the project timeline. Structure the tasks hierarchically using the Indent and Outdent features.

A big advantage is the interchangeable view mode. If you start the planning process in a map format, you can switch to a Gantt framework anytime. And this goes both ways - you begin by creating a Gantt file, yet you can view your work as a mind map or outline.
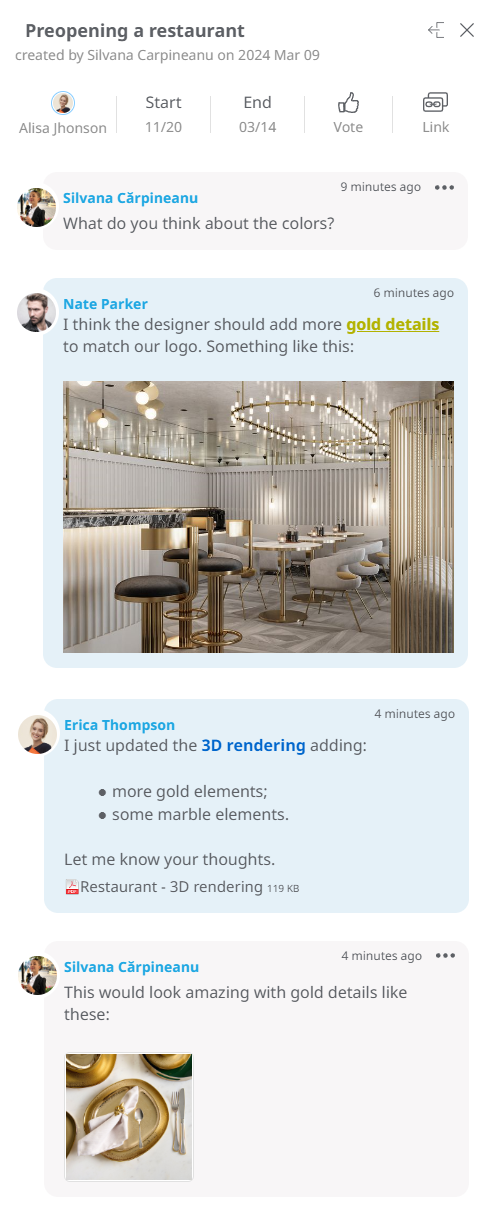
Real-time Collaboration
How do you manage multiple tasks effectively? First, you prioritize them based on urgency and importance.
If you’re not sure where to start, check out our guide on how to prioritize tasks using mind maps.
Second, you facilitate real-time, proactive collaboration between team members.
- Use the comments section to discuss, attach documents, links, images, and videos, and vote for the ideas you like best.
- You can also email an important comment to one of your collaborators.
- Make the most out of the live chat room to give timely feedback.
- All your team members can see the document changes in real-time.
On-project collaboration in Mindomo supports the critical path method, and even the most elaborate projects become easier to manage.
Keeping project progress on track
As a project manager, you have to keep an eye on the evolution of all activities. Track the progress of each task and each team member.
Besides the live editing feature, Mindomo helps you monitor the amount of time spent on completing the tasks and subtasks.
You can sync every task with the calendar application that you prefer. This way, it’s even more straightforward to track activities and their progress.
Thanks to the full history of changes, you can see exactly who did what and when. Therefore, assessing individual and team performance becomes easier.

Key components of a Gantt chart program
Mindomo’s Gantt chart looks very fresh and easy to use. If you are familiar with project management, you have experience with tools like Microsoft Project. But if you have never used project management software, working in Mindomo is the ideal starting option.
The Gantt chart has two main sections. On the right side, you will find the task list, along with some details about them. On the left side, there is a graphical illustration of the duration and progress of each task.
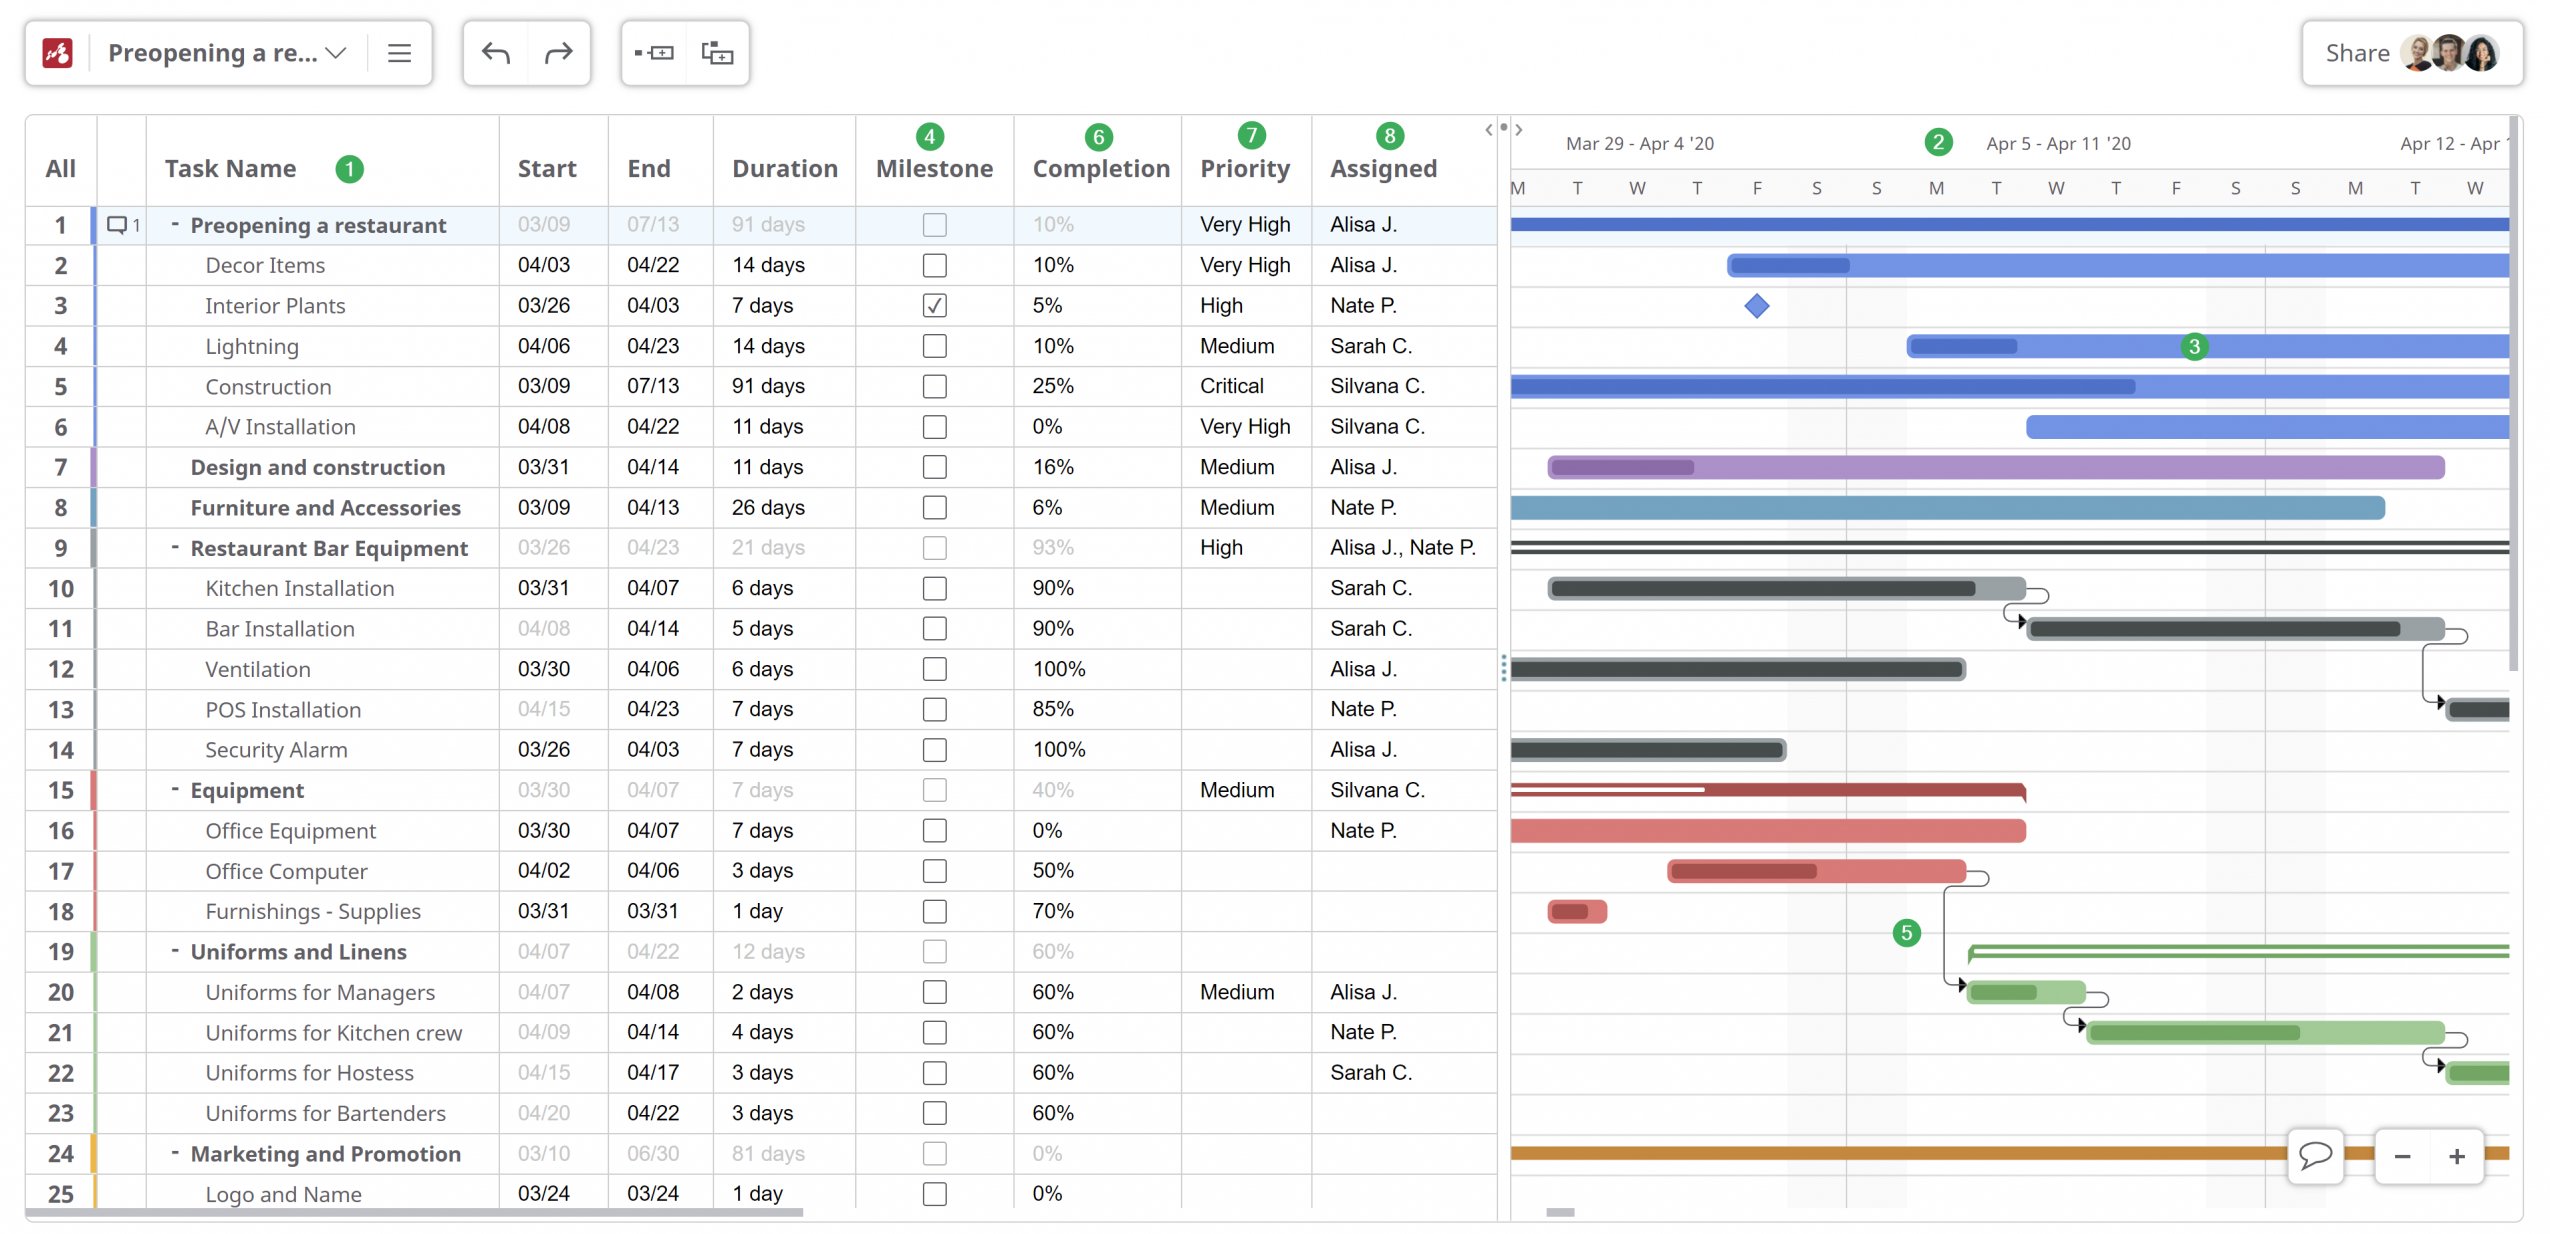
1. Task list
Large projects always have many tasks and subtasks. On the chart's left side, you will build your task hierarchy. You can organize tasks in groups and subgroups.
2. Project Timeline
It is found on the right side, running horizontally at the top of the Gantt chart. You can see the days, weeks, months, and years, covered in your project. The taskbars make it clear when each task starts/ends.
3. Bars
On the right side of the Gantt file, alongside each task, there is a bar. This will show the due dates, duration, and dependence on another task. You can edit those details by dragging and dropping them across the chart.
4. Milestones
In the Gantt file, milestones are displayed as diamonds. They represent major events, decisions, or anything important. Their completion offers a sense of satisfaction, so visualizing them serves as motivation. From the dedicated column, quickly check off any task that is a milestone.
5. Task dependencies
The tasks and related subtasks represent the actionable steps necessary for project completion. Consequently, successful project management relies on the exact order in which those steps must be completed.
6. Progress/Completion
A task is accomplished within a defined period or by a specific deadline. Its subtasks also have a defined start and end date or a deadline. Use the "Completion" column to mark percentages for each task's progress level. Any change of percentages in the subtasks will automatically calculate the completion of the main task.
7. Priority
When establishing project tasks and subtasks, you can indicate the priority level of each activity. Choose a suitable level from the following: critical, very high, high, medium, low, very low, or none.
8. Task assignment
Use the "Assigned" column to set which team members are responsible for which activities. This way, everyone on the project will know what to do. The assignee will be notified via email about their assigned task(s).
Online vs Offline Gantt chart creation
Achieving goals in a rapidly changing environment demands flexibility and several time-saving hacks. Mindomo’s online Gantt chart software supports a variety of time management techniques to increase your productivity.
Mindomo has an online version that is accessible from any browser. While working online, all your documents are saved in the cloud. However, you can also make Gantt charts offline using the desktop version. The syncing functionality will merge the web version with the desktop editings.
An online Gantt creator seems to be the best option, but it’s important to have an offline option as well. With Mindomo you don’t have to choose one or the other, you have full flexibility to use both!
Select your favorite Desktop version:
Easy project management with Mindomo
Plan and schedule your activities, collaborate with your team, and monitor the progress in one single program. The simpler the software is, the better for you and everyone involved.
Go to Mindomo’s website and sign up. You will be able to visualize, implement, and monitor projects of any complexity.