The terms “Spider Diagram” and “Mind Map” are used interchangeably. But are they the same thing? If not, how do they differ? And do the differences really matter?
In this article, we’ll discover that a Mind Map is a special type of Spider Diagram. The differences between them are small.
The more important question is why you would use visual tools to organize concepts and ideas. We’ll try to explain the differences between visual diagrams here and keep them in the context of a bigger picture.
The essential characteristics of Spider Diagrams
Spider Diagrams are visual frameworks for thinking. They have several characteristics that add value to the information present. Mind Maps inherit the same characteristics.
1. You can easily find the main idea
As it is always in the middle of the page. Finding the main idea can sometimes be made very difficult in text. Authors love to use cryptic headings that make sense only after you have digested the next ten pages.
2. Ideas are usually arranged in order of scale, from the center outwards.
Usually, the topics around the center give a complete overview, and small ideas branch out towards the edge. This is valuable intelligence before you even start to read. Again, linear text can make it difficult to distinguish small ideas from big ones until you start to understand the bigger picture.
3. The parent topic defines its context.
The parent of an idea or piece of information usually defines its context and relevance.
4. Ideas are associated with a physical position on the page.
While their location can move around, it gives you an extra trigger that helps to make it tangible. This is called “dual coding” (Paivio, 1986). Dual coding theory says that we can retrieve ideas and pieces of information either by words or through a physical association, such as a sense of location.
Mental models are a form of spatial memory and exist in parallel to language-based thinking. This aligns with Nesbit and Adesope’s finding that geographic maps help students to make more sense of written descriptions.
Returning to a place that you have not visited in a while often triggers memories of things that took place there. Mind Maps emphasize the use of color and images, and the physical act of drawing helps to reinforce memory.
5. It is quick and easy to add more details to a Spider Diagram
Creating a spider diagram or a mind map with software allows you to make maps much bigger than a page.
It helps when creating a Spider Diagram to think of it as an “Org Chart” for a given subject. The purpose of an Org Chart is well understood. if you draw an org chart, other people will understand why you did that. You can quickly see who the leader is, where people “fit”, who influences them, who they influence, and who else is in similar or related positions. If we change people to ideas, these insights are valuable things to know about any subject.
Concept Mapping outperforms reading and listening
In 2006, Nesbit and Adesope carried out a detailed study to determine whether using Concept Maps made a difference in students’ learning. Their conclusions are interesting and are often quoted. What they didn’t say is also interesting.
- A “geographic map” representing physical locations is always helpful when interpreting the text. It works for real objects and virtual ones.
- Concept mapping works better than reading, attending lectures, and even discussing knowledge transfer and retention.
- They did not focus very much on the detailed differences between concept maps and other visualizations. As Spider Diagrams and Mind Maps are just special cases of concept maps, they inherit the same basic benefits.
- Drawing concept maps was only slightly more effective than writing outlines.
- There was only a limited discussion of why drawing visualizations might be better than reading or listening to others. The benefits are often attributed to the format of the diagram. The reality is simpler than that. Converting something you have read into your own words works better than copying it or trying to memorize it.
Model maps diagrams
In his excellent books “Mapwise” and “Organise Ideas”, Oliver Caviglioli introduces Model Maps. Model Maps are diagrams that consist of words connected by lines or arrows. They are an external framework that reflects your understanding. Model Mapping is a system in which learners are the active creators of their own knowledge and not merely the recipients of someone else’s knowledge.
He also introduces “embodied cognition”, which is the idea that manipulating things can become an extension of your thinking. When you have learned a skill, you can do things without stopping to think. If you have learned to drive, you can probably remember the mental effort that it took when you first started. As you become more confident, instinct and experience start to take over.
Eventually, you can drive while having a conversation – something that seemed impossible at the start. Drawing model maps is a skill that can be learned in the same way. Nesbit and Adesope point out that the ability to draw meaningful visualizations is a good indicator of other skills. The ability to extract key meaning and underlying principles is a skill worth learning.
Writing is the only thing that matters
In the book “How to take smart notes”, Dr. Sönke Ahrens states that you cannot rephrase something if you don’t understand it. Reading something, hearing it, copying it, or highlighting it in a book can all happen without understanding it. To restate it in your own words, you need to understand it and connect it to other things you know.
All forms of word-link visual tools require you to restate and summarize ideas. As you add more detail and additional ideas to the information present, your understanding grows. This growth is sometimes attributed to the magic of the diagram. But the real magic is taking place in your brain as it tries to understand in real time, not just memorize for later.
Many Mind Mapping techniques talk about “capture”, but there is more to it than that. You need to convert things to your own words first, not just copy them. Then when you drag and drop ideas to reorganize them, you are creating links between your own thoughts, not someone else’s.
An advantage of visual tools is that you get clear feedback in real time. Creating a spider diagram lets you see what you think. You can then improve it straight away. Writing text does this too, but it is easy to lose sight of the big picture.
Mind mapping software is often associated with brainstorming. However, a brainstorming technique is only one way to get started. Ahrens points out that the real preparation has either already happened, or only begins after brainstorming. No matter how good your brainstorming technique is, it cannot produce anything that is not already in the participant’s head. Collecting and curating ideas need to take place over a long period of time to build a deep foundation for new ideas.
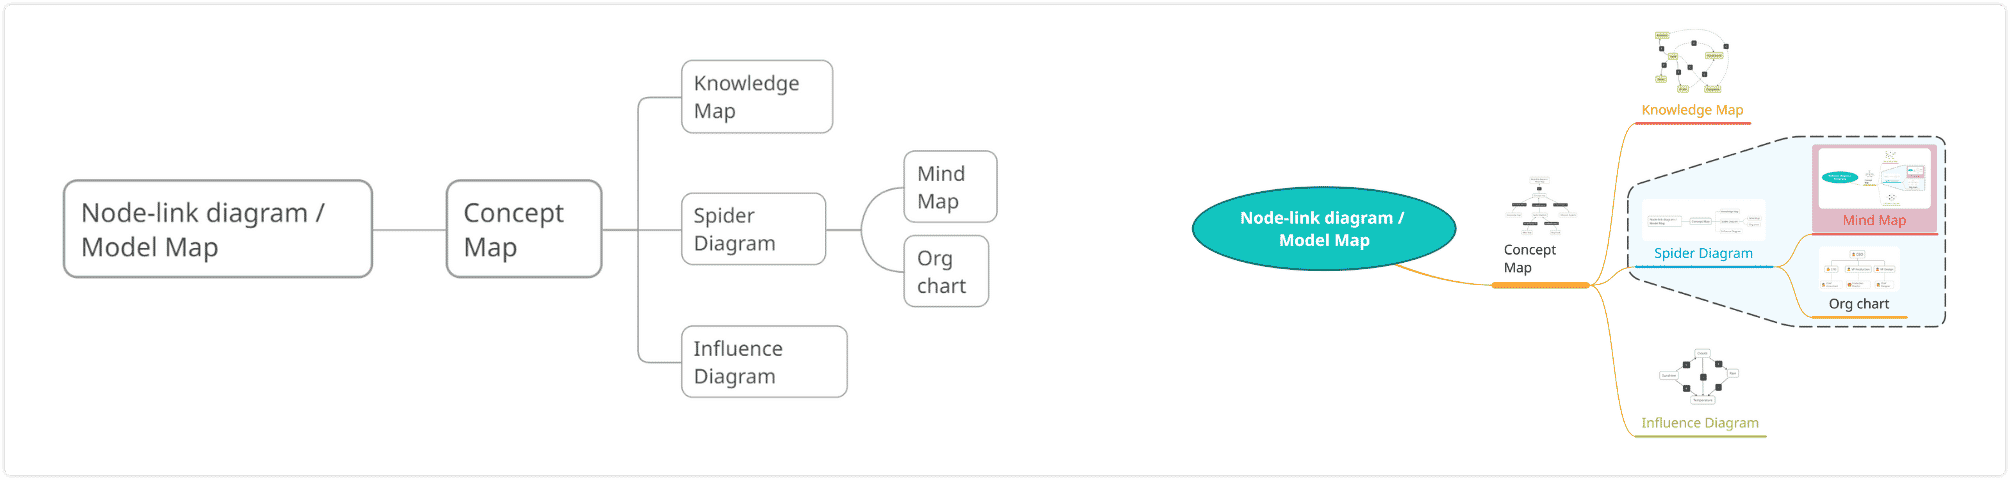
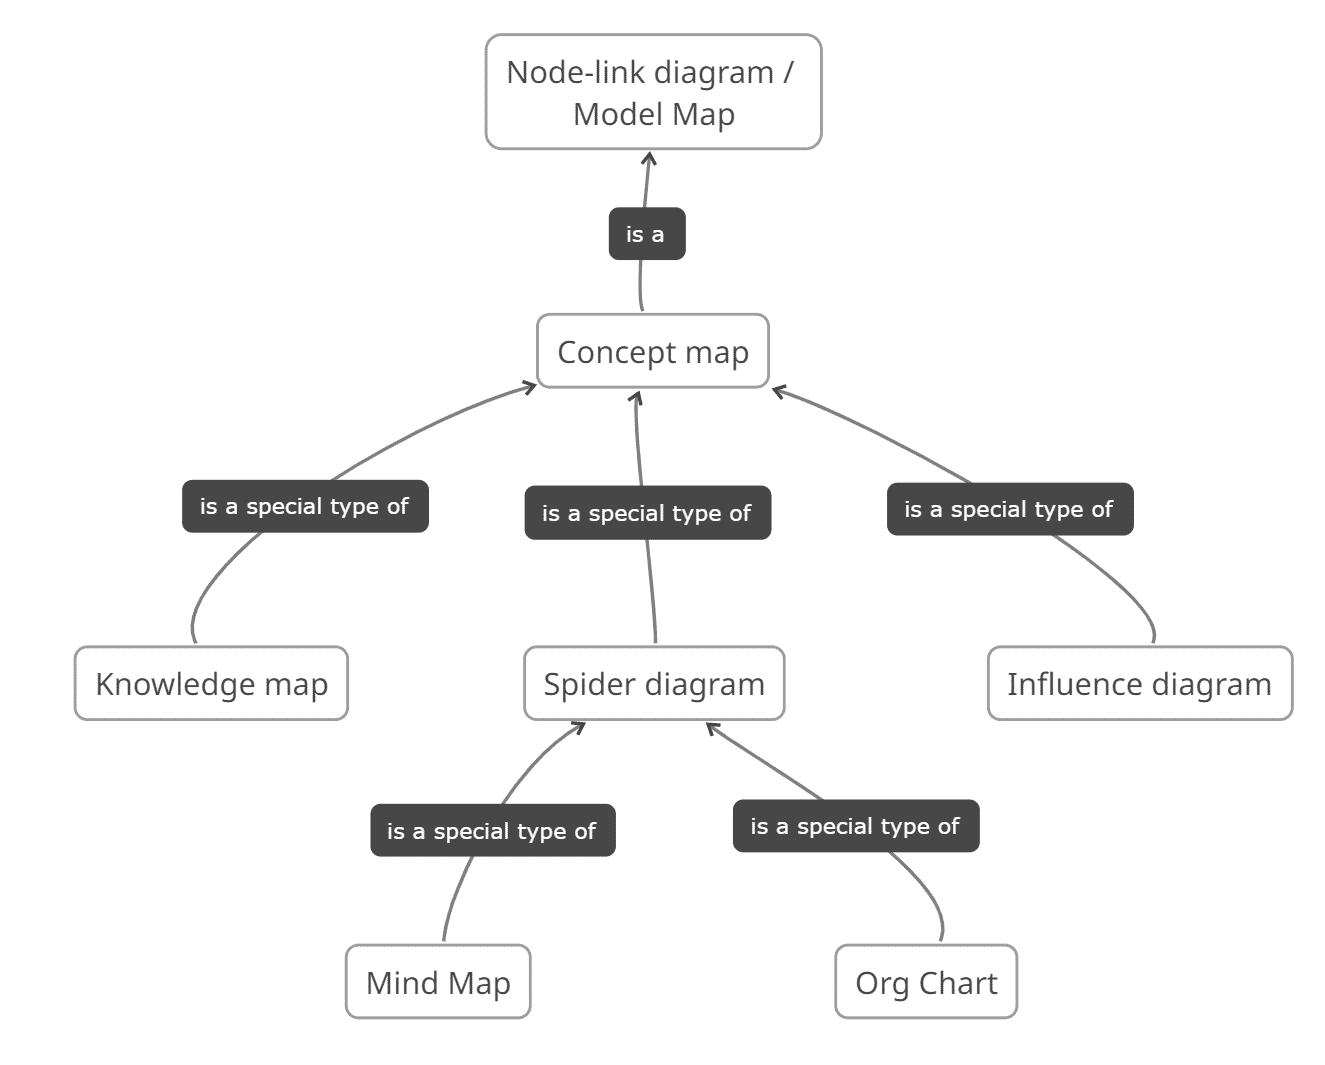
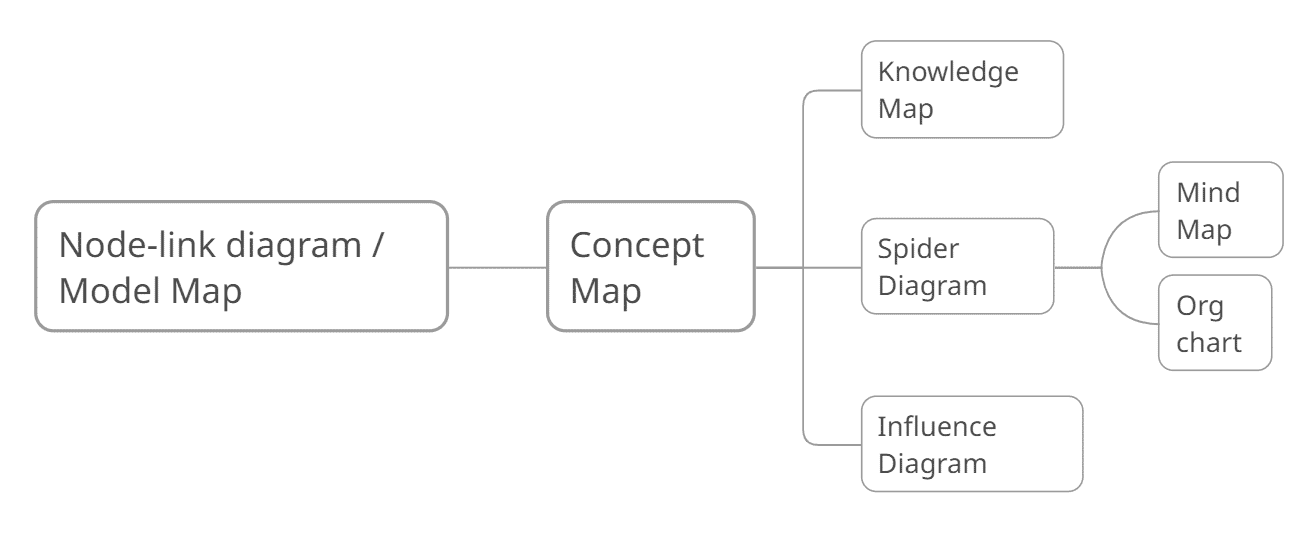
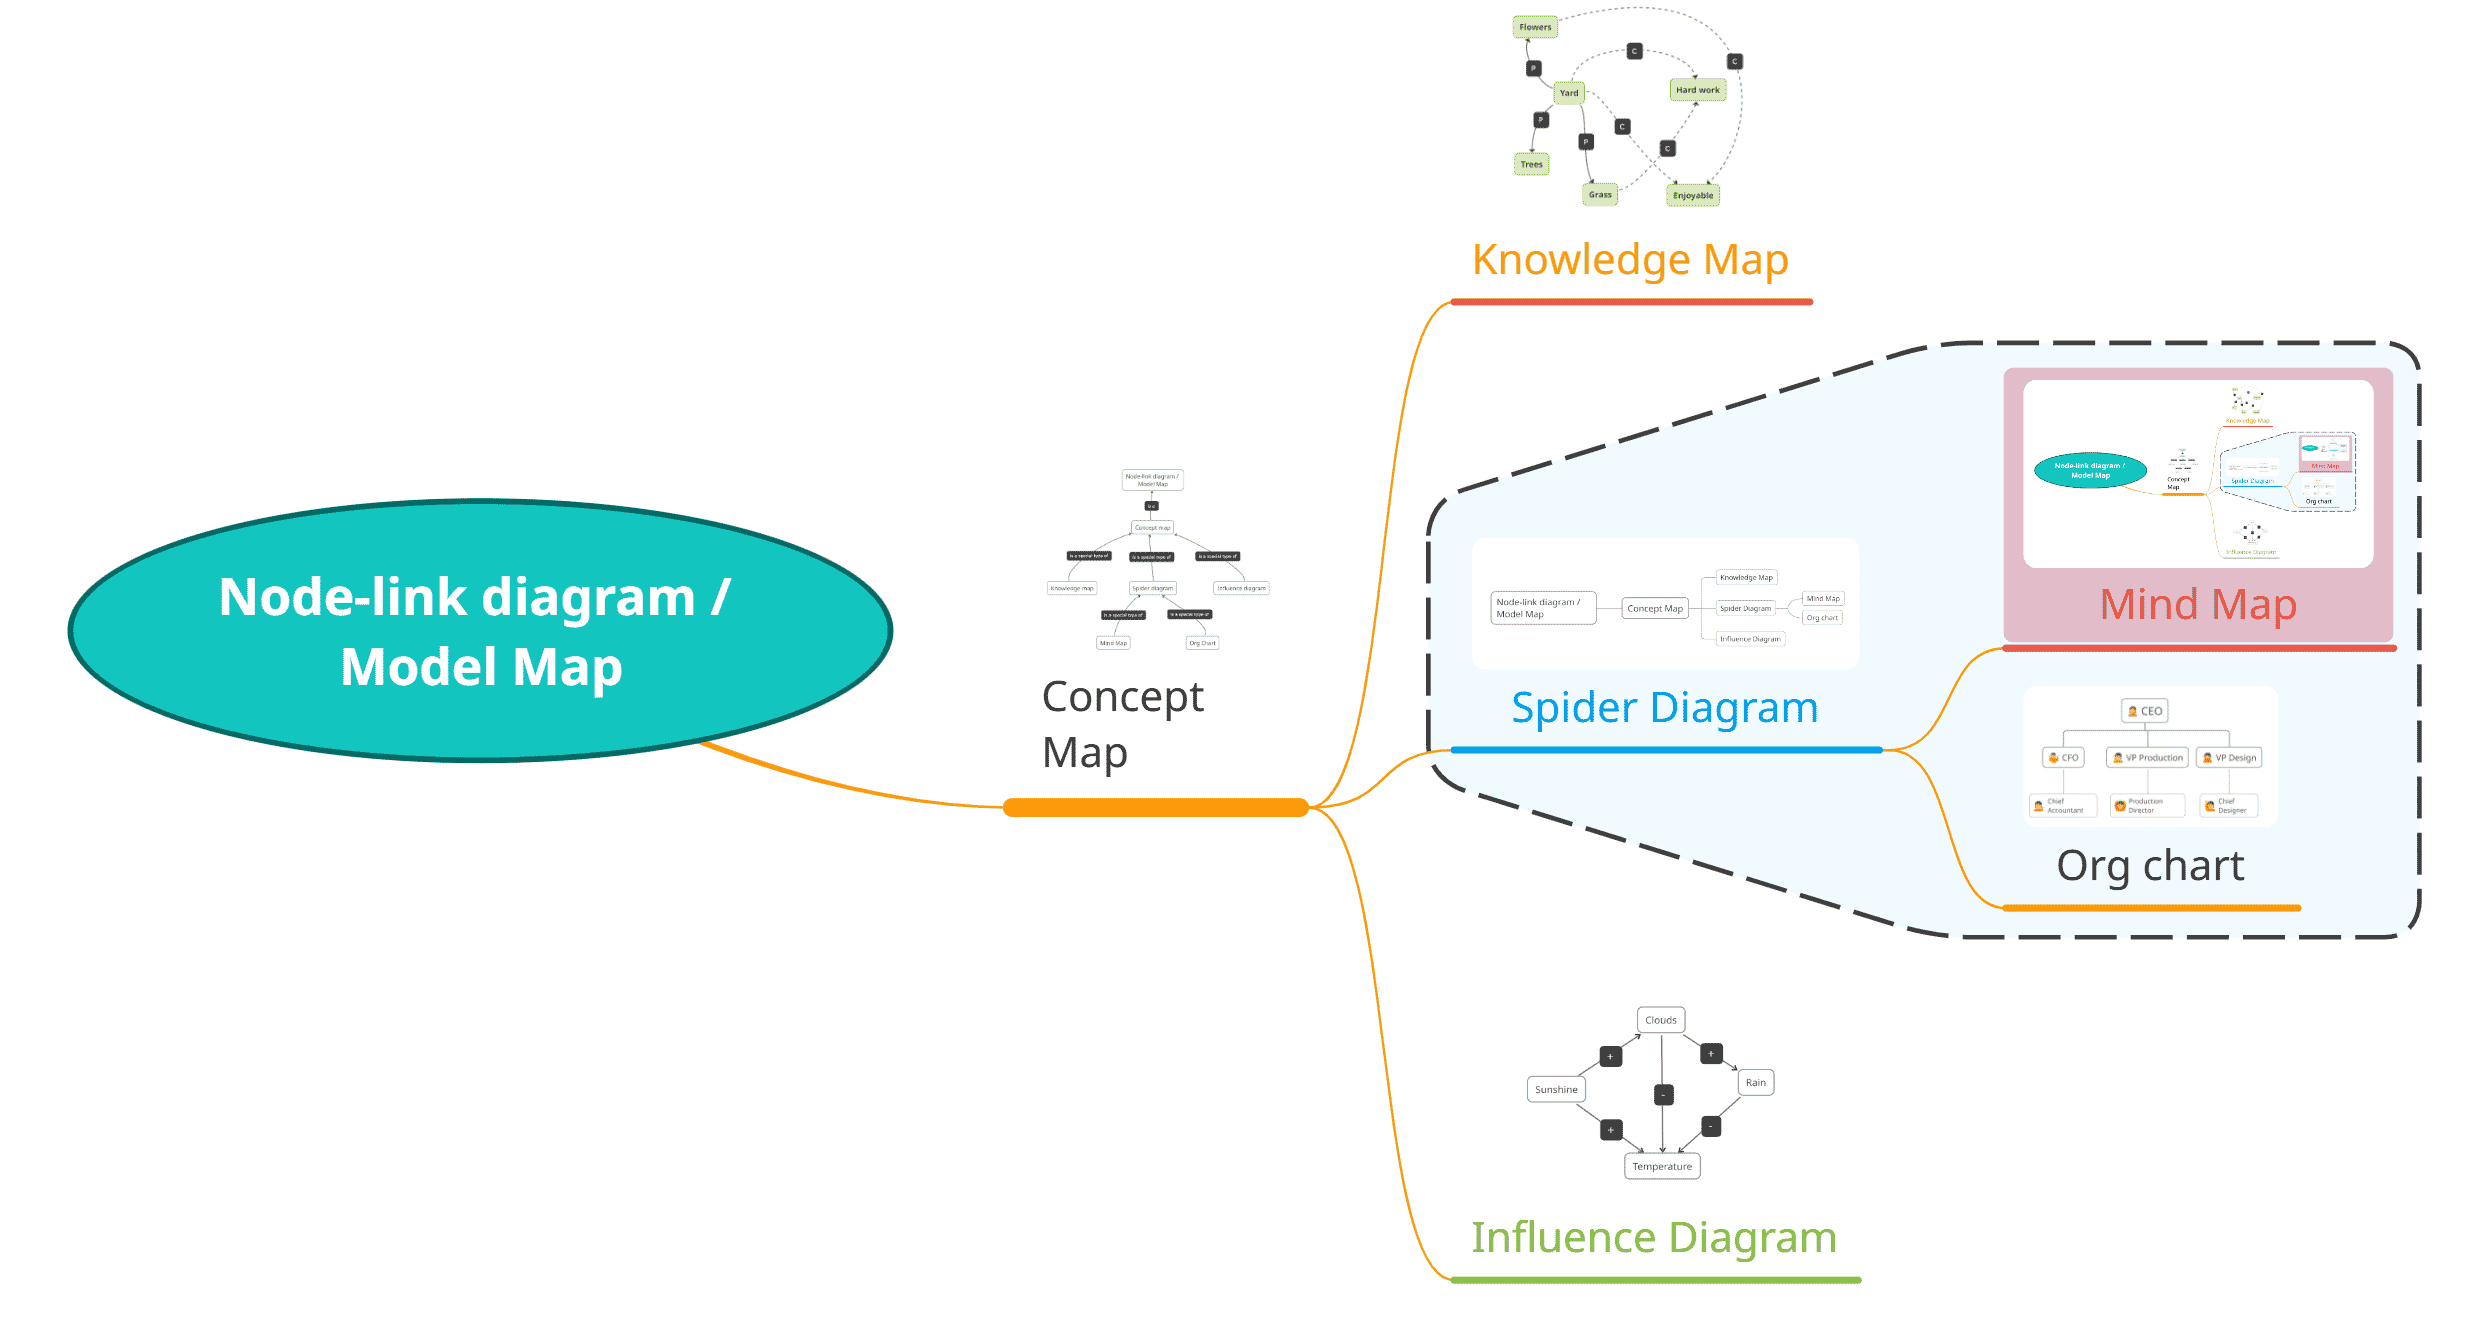
A Mind Map is a special type of a Spider Diagram
The “node-link diagrams” described by Nesbit and Adesope are Concept Maps. They use lines or arrows as connections between ideas.
Other forms of diagrams are derived from these by applying certain constraints or other rules. In general, these diagrams aim to give a complete overview of a subject at a high level. Spider diagrams and Mind Maps can embed more detail than the others.
Concept Map
A Concept Map is a network of ideas, connected by relationships. The relationships are directional and explain the connection between ideas. In a network, any idea can be connected to any other idea. Concept Maps get complicated quickly. It is hard to draw a concept map with more than 20 or 30 ideas or concepts in it. It becomes more and more difficult to add more details to a concept map (learn more about what is a concept map).
Knowledge Map
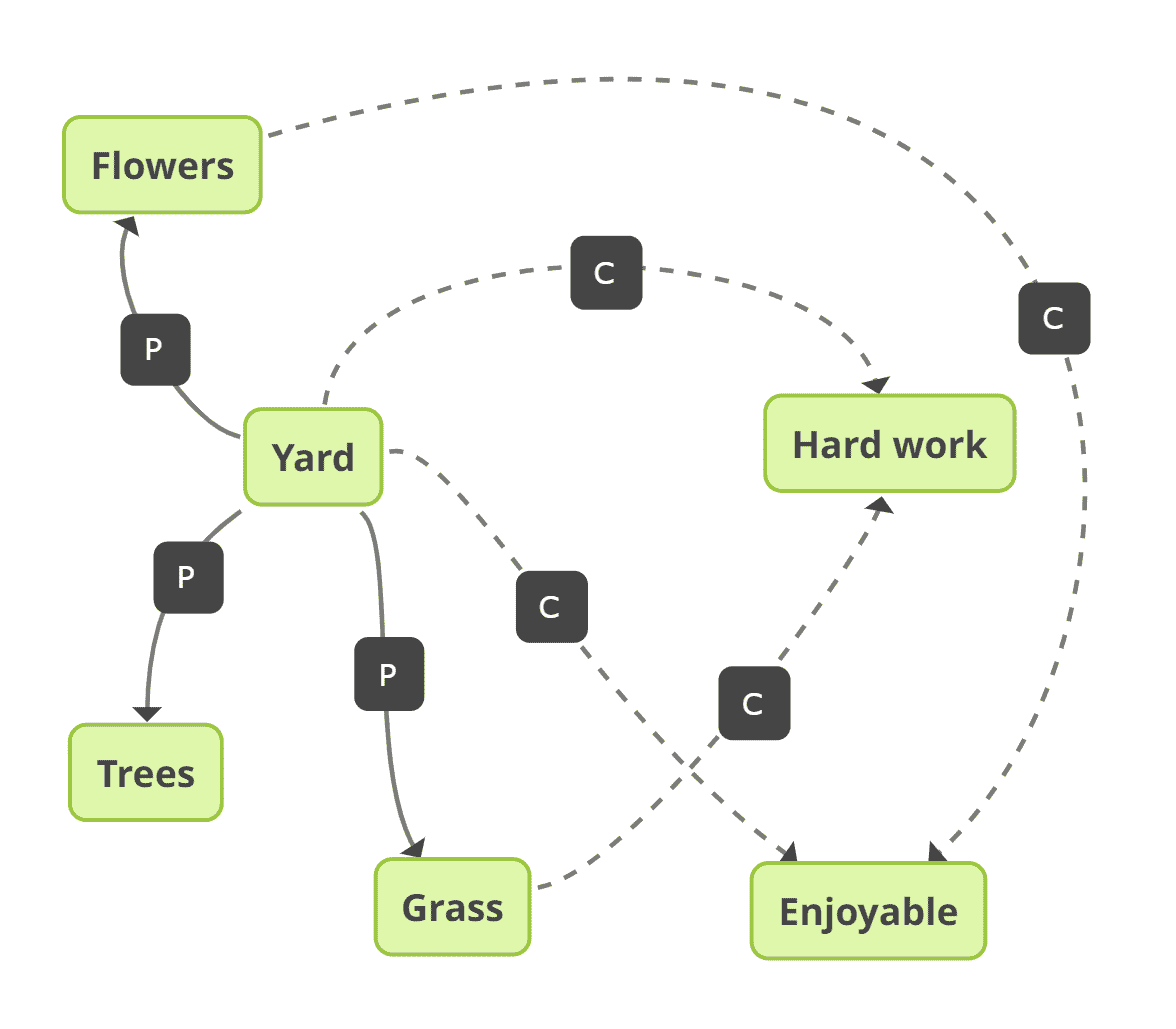
A Knowledge Map as defined by Nesbit and Adesope is a special type of Concept Map. Connections are limited to P (part of) or C (characteristic of). In this sense, Knowledge Maps are like Mind Maps. You may find many other different “definitions” of knowledge maps.
Influence Diagram
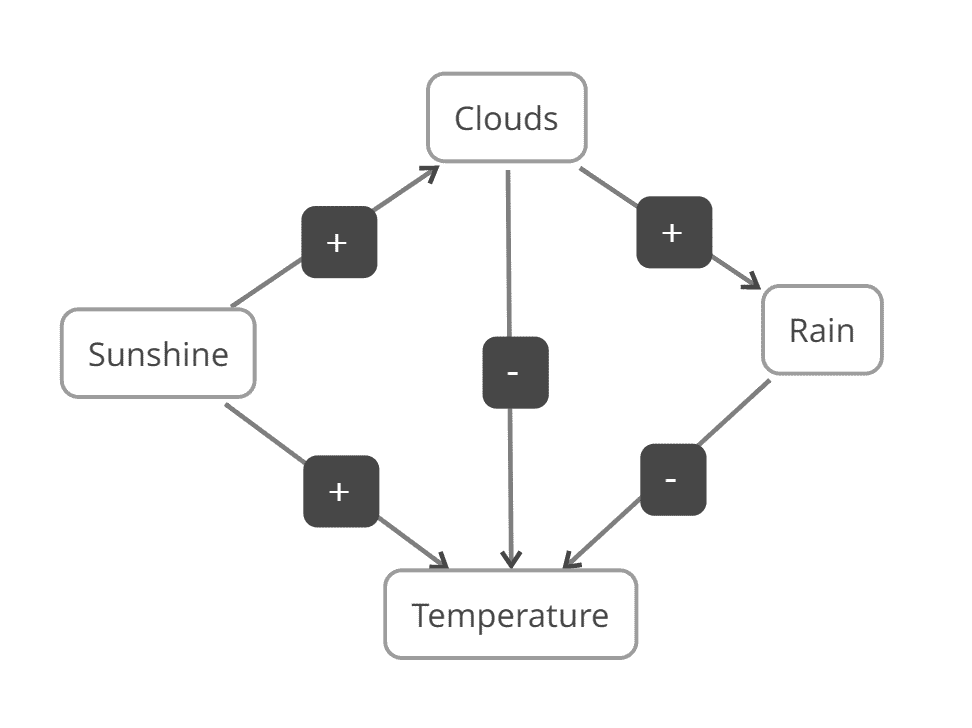
An Influence Diagram is a special case of a Concept Map. The connections show whether an item affects its neighbors positively or negatively. In the diagram above, sunshine increases temperature and also causes clouds to form. These diagrams can be used to model systems and understand how they behave.
Spider Diagram
A Spider Diagram is a special case of a Concept Map. It is the simplest of all the node-link diagrams. There are three important constraints in comparison to a Concept Map.
- There is a single, overarching topic in the middle of the page.
- Spider diagrams are visual trees rather than a network. Each idea can have only one parent topic. A topic may have one or more children. There is only one topic with no parents, at the center of the map.
- The connections between the topics are not explained. We assume that all the children of a topic have something in common.
Spider Diagrams can be much bigger because trees are easier to scale up. Creating a Spider Diagram is quick and easy, especially with software. Spider Diagrams are sometimes called Spray Maps, Tree Diagrams, or Inductive Towers. Spider diagrams are often used as a brainstorming technique, where ideas branch out from each other.
Mind Map
A Mind Map is a special case of a Spider Diagram. There are three differences between a Spider Diagram.
- Each idea should be only a one-word reminder of something you know.
- The connections should flow organically. Curved lines are usually recommended.
- The map should use plenty of color and images.
Mind Map diagrams are visual revision aids, designed to help memorize information for exams. The images and organic shapes help with recall.
Org Chart
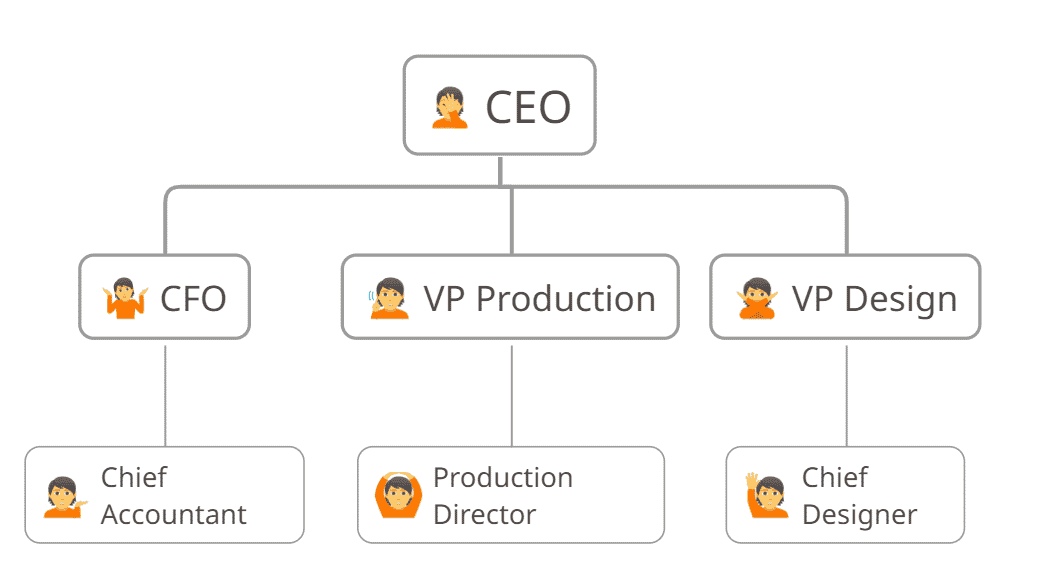
An Org Chart is a special case of a Spider Diagram. It is usually arranged with a single center at the top, with a series of other levels below. In an Org Chart, the depth from the top has a specific meaning. People or groups on the same level share some characteristics even if they are connected to different parents. There may also be connections across the tree or across levels.
Taking it to the next level with spider diagram software
Creating a Spider Diagram with software brings other benefits. You can start with a spider diagram template and organize concepts and ideas with drag and drop. Working collaboratively in real time with other users is great for generating additional ideas and understanding other viewpoints.
The software also makes it easy to use templates. A Spider Diagram Template is made up of a design, some existing ideas, and existing connections. In one sense, a Spider Diagram Template is a contradiction in terms, because spider diagrams are visual models of thinking, and a “template” suggests that you only need to fill the blanks for it to work. This is rarely the case because every situation is different. Templates are great for getting started, but at some point, you must take over and make the map your own.
In this article, we have seen how a Spider Diagram is a special case of a Concept Map and is simpler than a Mind Map. “Spider Diagram” is a perfectly good description for most of the maps that mind mapping software creates. What matters the most is the knowledge that is captured in the map, rather than the exact name or design details.
Try Mindomo now and start creating any of these diagrams: mind maps, concept maps, spider diagrams, org charts, influence diagrams, knowledge maps, and more!
Keep it smart, simple, and creative!
Author: Nick Duffill