This template allows you to plot and analyze information across two dimensions, using two distinct axes to reveal trends and relationships. Start by entering your data points along the horizontal and vertical axes. Use the chart to compare variables, track performance, or illustrate data trends clearly. Ideal for reports, presentations, and data analysis, this template provides a structured way to visualize and interpret complex information. What does the left/right position represent? What does the up/down axis on your chart represent? Add items or ideas to your chart, and consider where they belong on each the two axes. Drag and drop items to position them in the right place. What does your chart show? Type the title and press Enter. A gondolattérképek segítenek az ötletelésben, a fogalmak közötti kapcsolatok kialakításában, a rendszerezésben és az ötletek generálásában. A gondolattérkép-sablonok azonban könnyebb utat kínálnak a kezdéshez, mivel ezek olyan keretek, amelyek egy adott témával kapcsolatos információkat tartalmaznak, irányadó utasításokkal. Lényegében a gondolattérkép minták biztosítják azt a struktúrát, amely egy adott téma összes elemét egyesíti, és kiindulópontként szolgál az Ön személyes gondolattérképjéhez. Forrást jelentenek arra, hogy praktikus megoldást nyújtsanak egy adott témával kapcsolatos gondolattérkép létrehozásához, akár üzleti, akár oktatási céllal. A Mindomo intelligens gondolattérkép-sablonokat kínál, amelyek lehetővé teszik, hogy könnyedén működjön és gondolkodjon. Választhat a Mindomo üzleti vagy oktatási fiókjaiból, vagy létrehozhatja saját gondolattérkép sablonjait a semmiből. Bármilyen gondolattérkép átalakítható gondolattérkép-sablon térképpé, ha az egyik témakörhöz további irányadó jegyzeteket ad hozzá.2 axis chart
This template helps you to draw a 2-axis chart and evaluate ideas or items by two properties at the same time. For example, charting 'value' and 'risk' could help you decide what is the most important thing to do next.
The position of items or ideas shows important groupings and helps with prioritization.
Keywords: prioritization, ideas evaluation, task management, Planning & Organizing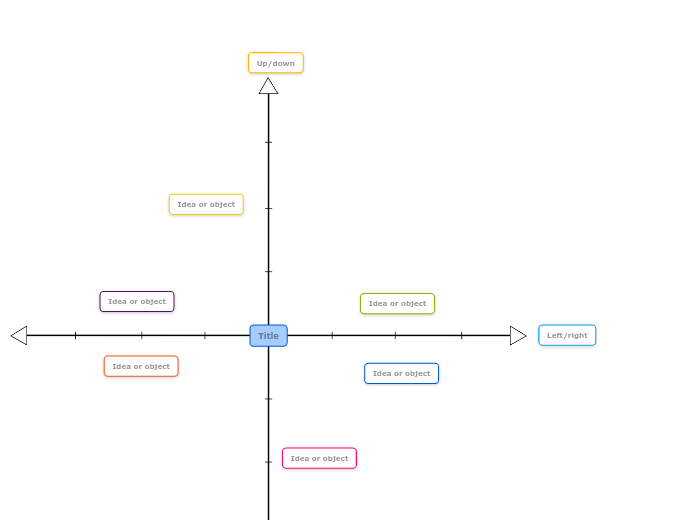
2 axis chart template
Left/right
For example, it might represent high value to the right, medium in the middle and low value to the left.Up/down
For example, items above the centre line can be high risk, and items below the centre line are low risk.Idea or object
Double-click to add new items or ideas.Title
For example, your chart might show how ideas are ranked by risk on the up/down axis and value on the left/right axis. This can help with decision making.Miért érdemes Mindomo gondolattérkép mintát használni?
Egy sablon különböző funkciókkal rendelkezik:


")
