This template allows you to plot and analyze information across two dimensions, using two distinct axes to reveal trends and relationships. Start by entering your data points along the horizontal and vertical axes. Use the chart to compare variables, track performance, or illustrate data trends clearly. Ideal for reports, presentations, and data analysis, this template provides a structured way to visualize and interpret complex information. What does the left/right position represent? What does the up/down axis on your chart represent? Add items or ideas to your chart, and consider where they belong on each the two axes. Drag and drop items to position them in the right place. What does your chart show? Type the title and press Enter. Mapy myśli pomagają w burzy mózgów, nawiązywaniu relacji między pojęciami, organizowaniu i generowaniu pomysłów. Jednak szablony map myśli oferują łatwiejszy sposób na rozpoczęcie, ponieważ są to ramy, które zawierają informacje na określony temat z instrukcjami przewodnimi. W istocie, szablony map myśli zapewniają strukturę, która łączy wszystkie elementy określonego tematu i służy jako punkt wyjścia dla Twojej osobistej mapy myśli. Są zasobem, który dostarcza praktycznego rozwiązania do tworzenia mapy myśli na określony temat, zarówno dla biznesu, jak i edukacji. Mindomo oferuje inteligentne szablony map myśli, które pozwalają funkcjonować i myśleć bez wysiłku. Możesz wybierać spośród różnych szablonów map myśli z kont biznesowych lub edukacyjnych Mindomo, lub możesz tworzyć własne szablony map myśli od podstaw. Każda mapa myśli może zostać przekształcona w mapę szablonu mapy myśli poprzez dodanie dalszych notatek przewodnich do jednego z jej tematów.2 axis chart
This template helps you to draw a 2-axis chart and evaluate ideas or items by two properties at the same time. For example, charting 'value' and 'risk' could help you decide what is the most important thing to do next.
The position of items or ideas shows important groupings and helps with prioritization.
Keywords: prioritization, ideas evaluation, task management, Planning & Organizing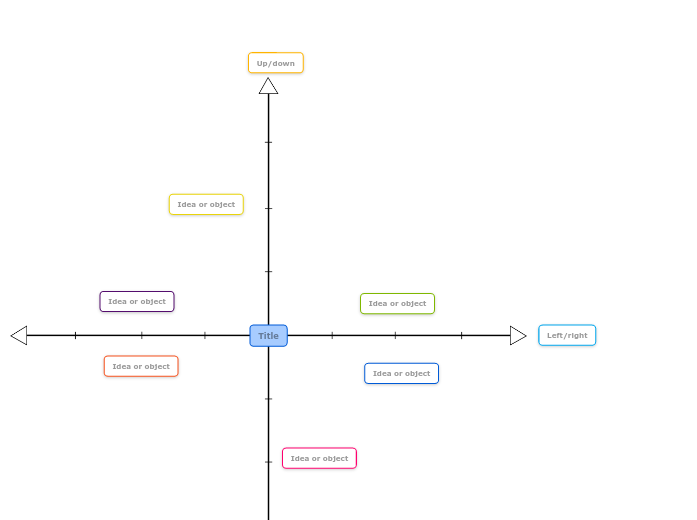
2 axis chart template
Left/right
For example, it might represent high value to the right, medium in the middle and low value to the left.Up/down
For example, items above the centre line can be high risk, and items below the centre line are low risk.Idea or object
Double-click to add new items or ideas.Title
For example, your chart might show how ideas are ranked by risk on the up/down axis and value on the left/right axis. This can help with decision making.Dlaczego warto używać szablonów map myśli Mindomo?
Szablon ma różne funkcjonalności:

")

