This template helps you to draw a 2-axis chart and evaluate ideas or items by two properties at the same time. For example, charting 'value' and 'risk' could help you decide what is the most important thing to do next. This template allows you to plot and analyze information across two dimensions, using two distinct axes to reveal trends and relationships. Start by entering your data points along the horizontal and vertical axes. Use the chart to compare variables, track performance, or illustrate data trends clearly. Ideal for reports, presentations, and data analysis, this template provides a structured way to visualize and interpret complex information. What does the left/right position represent? What does the up/down axis on your chart represent? Add items or ideas to your chart, and consider where they belong on each the two axes. Drag and drop items to position them in the right place. What does your chart show? Type the title and press Enter. Mindmaps helpen je bij brainstormen, het leggen van verbanden tussen concepten, organiseren en ideeën bedenken. Met een mindmapsjabloon ga je nog makkelijker aan de slag: het is een kader met informatie over een specifiek onderwerp en begeleidende instructies. Een sjabloon geeft je dus de structuur die alle elementen van een onderwerp samenbrengt, en dient als startpunt voor je eigen mindmap. Zo maak je op een praktische manier een mindmap over een bepaald onderwerp, zowel in het bedrijfsleven als in het onderwijs. Mindomo biedt slimme mindmapsjablonen waarmee je moeiteloos kunt werken en denken. Je kunt kiezen uit verschillende mindmapsjablonen van de zakelijke of educatieve accounts van Mindomo, of je eigen mindmapsjablonen maken. Elke mindmap kun je omzetten in een sjabloon door extra notities toe te voegen aan een van de onderwerpen.2 axis chart
The position of items or ideas shows important groupings and helps with prioritization.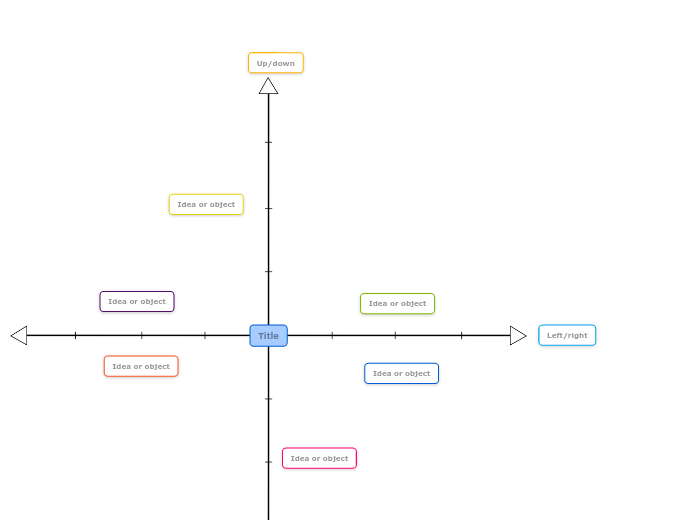
Over dit sjabloon
2 axis chart template
Left/right
For example, it might represent high value to the right, medium in the middle and low value to the left.Up/down
For example, items above the centre line can be high risk, and items below the centre line are low risk.Idea or object
Double-click to add new items or ideas.Title
For example, your chart might show how ideas are ranked by risk on the up/down axis and value on the left/right axis. This can help with decision making.Waarom een mindmapsjabloon van Mindomo gebruiken?
Een sjabloon biedt verschillende functies:
-
Producten
-
Toepassingen
- Algemene toepassingen
- Mindmaps voor het onderwijs
- Mindmaps voor bedrijven
- Mindmaps voor persoonlijke ontwikkeling
- Ondersteunende technologie
- Teamsamenwerking
- Campagnebriefs voor marketeers
- Verkenningsworkshops met klanten voor consultants
- Onboardingtrajecten voor HR en L&D
- Kennismanagement
- Vaardighedenmatrix voor teams
- Opdrachtenbibliotheek
- Rollen
- Marketeers
- HR en L&D
- Consultants
- Projectmanagement
- Planning van marketingcampagnes
- Uitrol van medewerkerstrainingen
- Werkomschrijving
- Ideeën ordenen
- Probleembomen
- Analyse van opleidingsbehoeften
- Voordelen van mindmappen
-
Oplossingen
- Handleidingen
- Presentaties maken met mindmaps
- Leren met mindmaps
- Plannen en organiseren met mindmaps
- Taken prioriteren met mindmaps
- Notities maken met mindmaps
- Klantverhalen uit de praktijk
- Educatieve content opschalen voor 11.000 artsen
- Teamworkflow: van proefperiode naar onmisbaar in twee maanden
- 10 jaar zonder slides: architectuurcolleges opnieuw bedacht
- Alle verhalen lezen
-
Hulpbronnen
- De basis
- Wat is een mindmap?
- Hoe maak je een mindmap?
- Wat is een conceptmap?
- Mindmapideeën voor studenten
- Handleidingen en support
- Videohandleidingen
- Helpcentrum
- Forum
- Voorbeelden en sjablonen
- Mindmapideeën
- Tool voor ondersteunende technologie
- Top 29 mindmapvoorbeelden
- Functiepagina's
- Onderwijs
- Opdrachten voor docenten
- Werk en privé
- Desktop
- De Mindomo-blog
- Prijzen
- Inloggen
- Aanmelden
- Dashboard
Voordelen van mindmappen
Waarom visueel denken onthouden en plannen makkelijker maakt.
De basis
Handleidingen en support
Voorbeelden en sjablonen
Functiepagina's
 Blog
De Mindomo-blog
Gidsen, voorbeelden en onderzoek over visueel denken.
Alle artikelen bekijken