What a Gantt chart shows
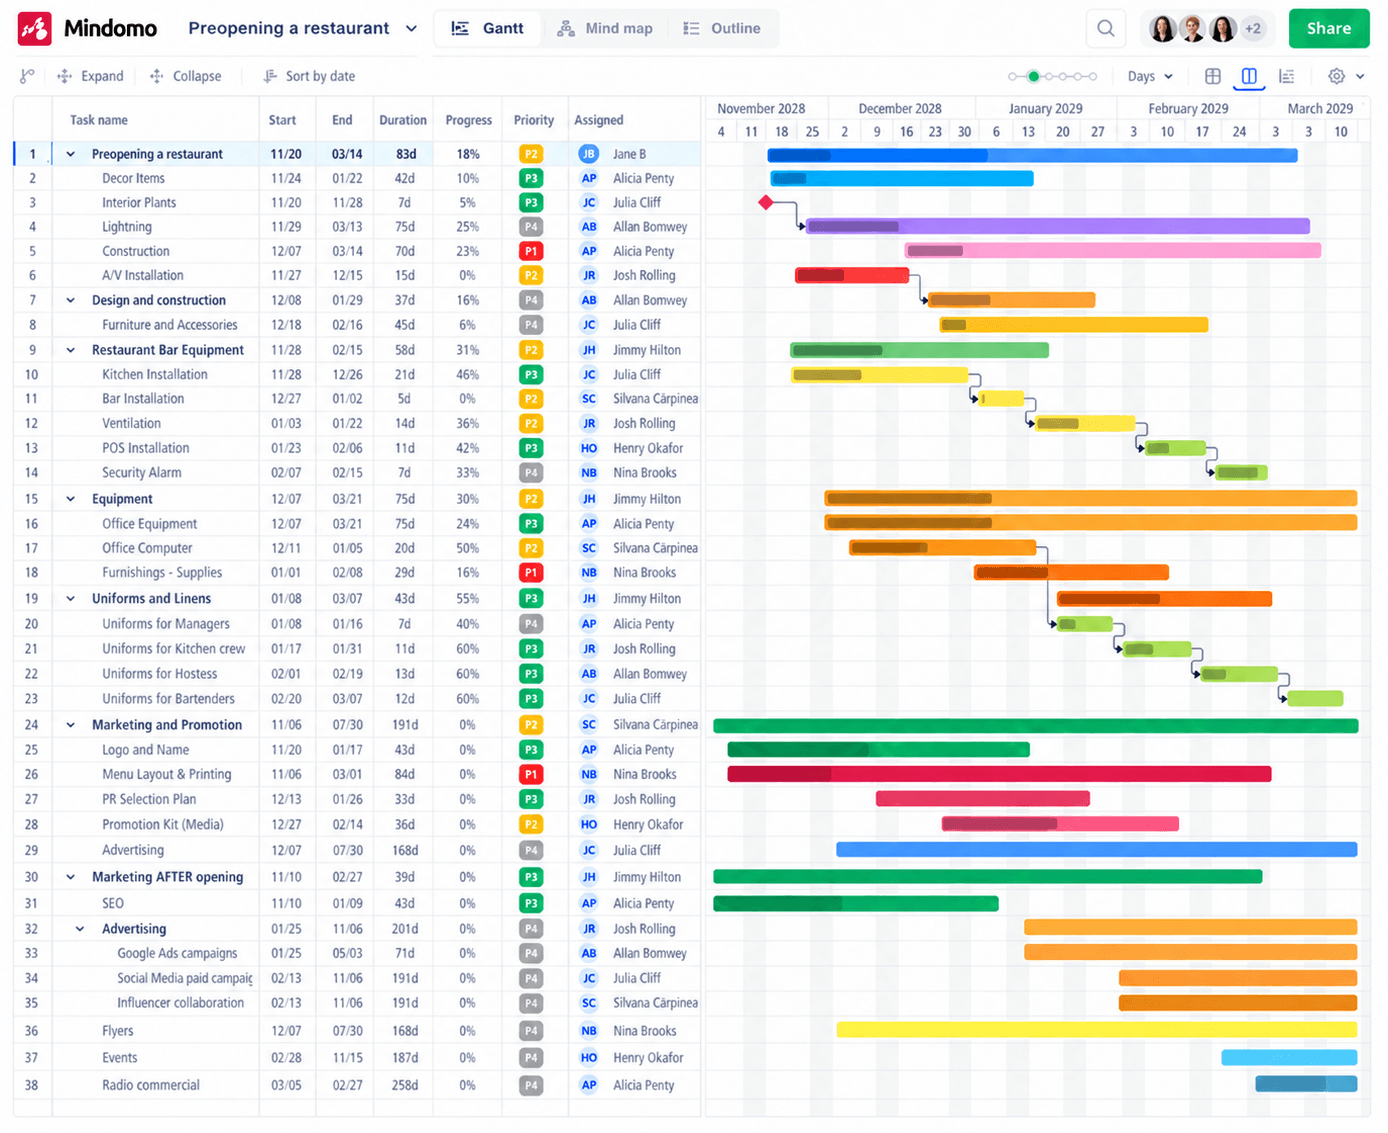
A Gantt chart is a project schedule drawn on a timeline. It has a few simple parts:
- Tasks as rows. Each task gets its own line, listed on the left.
- Bars on a timeline. A bar starts on the task’s start date and ends on its end date. Its length is the duration.
- Phases as summary bars. A phase groups related tasks. Its bar runs from the first task’s start to the last task’s end.
- Arrows for dependencies. An arrow shows that one task has to wait for another.
- Diamonds for milestones. A diamond marks a key date, such as a launch.
- Progress on the bars. The filled part of a bar shows how much of the task is done.

Before you start: nothing to prepare
You don’t need anything prepared before: no plan, no task list, no dates. Start with just the idea of your project. The steps below guide you through putting everything in place, one question at a time, and you can change any answer later.
- What is the work? Add the phases, then the tasks inside them (step 1 and step 2). Not sure yet? Brainstorm them in a mind map first.
- How long will each task take? A rough guess is enough (step 3). Change it later and the bar adjusts.
- What has to happen first? Link the tasks (step 4). Pages can’t be built before they are designed, and when the design slips, Mindomo moves the build for you.
- Which dates can’t move, and who does what? Add milestones such as the launch day, then owners (step 5 and step 6).
Steps to create a Gantt chart in Mindomo
1. Start the chart
There are two ways to begin.
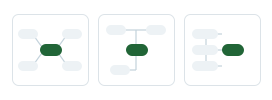
Route A: start from a mind map. Brainstorm the relaunch as a mind map: put the project in the center and the four phases around it. You can also use the outline view eiher to start, or just to put the tasks in order, then choose View as Gantt.
The mind map, the outline and the Gantt chart are three views of the same document. You type nothing twice, and switching views loses nothing.

Route B: start straight from a Gantt chart.
If the schedule is what you will use most, start with the Gantt chart layout. You can start adding tasks and subtasks.

2. Build the task list and phases
Type straight into the grid. It works like a spreadsheet: arrow keys move between cells, Tab and Enter move on, and F2 edits a cell. Press Tab past the last cell and a new task is added.
Enter the four phases first which will be the 4 main tasks of our project (Content audit, Design, Build and Launch). To add the same level task you can use the shortcuts CTRL + Enter (to add a task below) or Shift + Enter (to add a task above). Then add the subtasks under each phase, using the shortcut CTRL + Shift + Enter
A phase acts as a summary task. Its bar spans the tasks inside it, so you never set its dates by hand. WBS numbers (1, 1.1, 1.2) follow the outline automatically. If you move “Set up redirects” into the Launch phase, it is renumbered for you.

3. Set dates and durations
Set the working calendar first. Choose the working days, the time the workday starts, the hours per day and the first day of the week. Durations, links and the critical path are all counted in this working time, so set it before you enter dates.
Then give each task a start date and either an end date or a duration. For example, Wireframes starts on a Monday and lasts 5 days. You only need dates on the first tasks. In step 4, links will place the rest.
For short tasks, you can schedule by the hour. Bars snap to the hour inside working hours.

4. Link dependent tasks
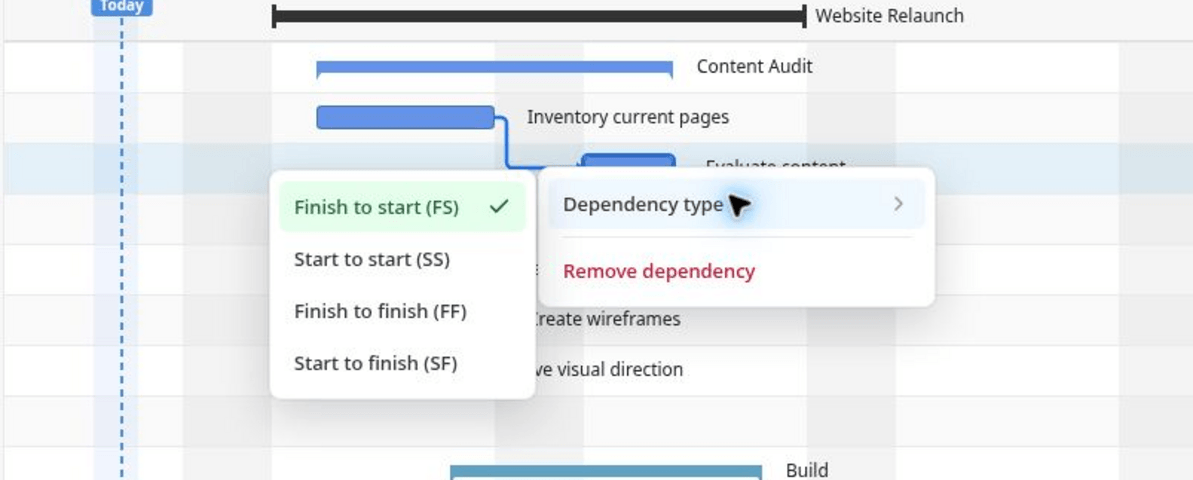
To link two tasks, drag from a bar’s handle onto the other bar. An arrow appears between them. There are four link types. Each one below has an example from the relaunch:
- Finish to start (FS): Build page templates can start only after Visual design finishes. This is the most common type.
- Start to start (SS): Migrate content can start once Build page templates has started. The two then run side by side.
- Finish to finish (FF): QA testing can finish only when Set up redirects has finished.
- Start to finish (SF): the old site can be switched off only after Go live has started. This type is rare.

5. Add milestones
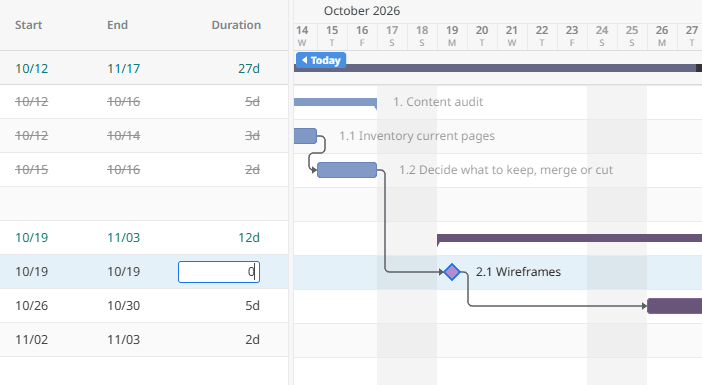
A milestone is a moment, not a piece of work. To make one, give a task a duration of zero. It turns into a diamond on the timeline.
In the relaunch, Go live is the milestone. Link it to the tasks that must be done first, QA testing and Train the editors. When either of them slips, Go live moves with them, and you see it at once.
6. Assign owners and work together
Give every task an owner. A task can have more than one assignee, and you can assign it in two ways:
- To a collaborator. Share the diagram with the people doing the work, then assign tasks to them. They are notified about their tasks and can edit the Gantt chart with you. Collaborators don’t need a Mindomo account, which helps when a freelance designer or the client’s IT team owns part of the work. Sharing with people who don’t have an account is a Professional feature.
- To a guest user. A guest user is just a name on the task, so you can keep track of who is doing what. The person doesn’t get access to the Gantt chart.

Collaborators can edit the chart at the same time as you, and you see who is working on which task. Talk in the editor’s chat, or comment on a task so the discussion stays with the work. You choose how much access each person gets: share a read-only link with the client, set roles for the team, or protect a link with a password. Each person can also follow their own tasks in Google Calendar, Outlook or Apple Calendar by subscribing to an iCal feed.
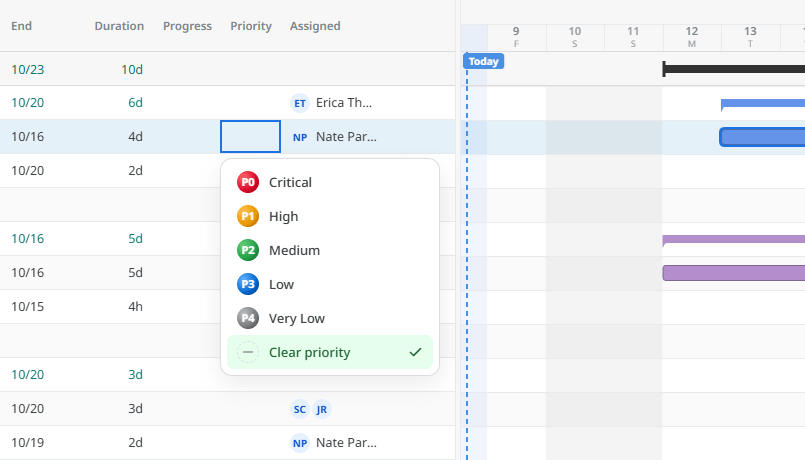
Then give each task a priority, so everyone knows what to do first. There are five levels:
- P0 Critical: the project fails without it. In the relaunch, Set up redirects is P0, because missing redirects would cost search traffic on launch day.
- P1 High: important and needed on time, such as QA testing.
- P2 Medium: regular work that follows the schedule, such as Migrate content.
- P3 Low: useful, but it can wait if time runs short, such as Train the editors.
- P4 Very low: nice to have, done only when there is spare time.
Click a task to open its panel. Everything about the task is in one place: status, priority, dates, estimate, description, dependencies, attachments and comments. You can also copy a link to the task from the panel and share it.
7. Check the critical path
Turn on Critical path in the toolbar. The tasks that decide the end date are marked with a red ring.
In practice, this means a delay on any of these tasks delays Go live. A delay on the other tasks does not, as long as it stays within their slack. So the critical path tells you where to look first when something slips.

8. Choose the right view
Pick a layout for the job at hand: the grid only, a split view with the grid next to the timeline, or the timeline only.
There are six time scales: hours, days, weeks, months, quarters and years. You can zoom from 40% to 400%. Days off can be shaded or collapsed, and week numbers can be shown.
It is the same chart at every scale. Use days to plan this sprint of the Build phase, then switch to quarters to show the relaunch at a board meeting.

9. Track progress and keep the plan current
A plan is only useful while it matches reality. To update progress, drag the knob on a bar, use the slider, or type a number. Phases calculate their progress from the tasks inside them, so the Build phase shows its overall progress on its own.
The today line and the overdue highlighting show what should already be done. A bar that sits left of the today line and isn’t full needs attention.
You can turn on notifications by email, push or in-app. They fire when a task is assigned, completed or re-dated. A digest at 08:00 lists what is overdue, due today and due this week. To see who changed what, filter the History by task or by person.
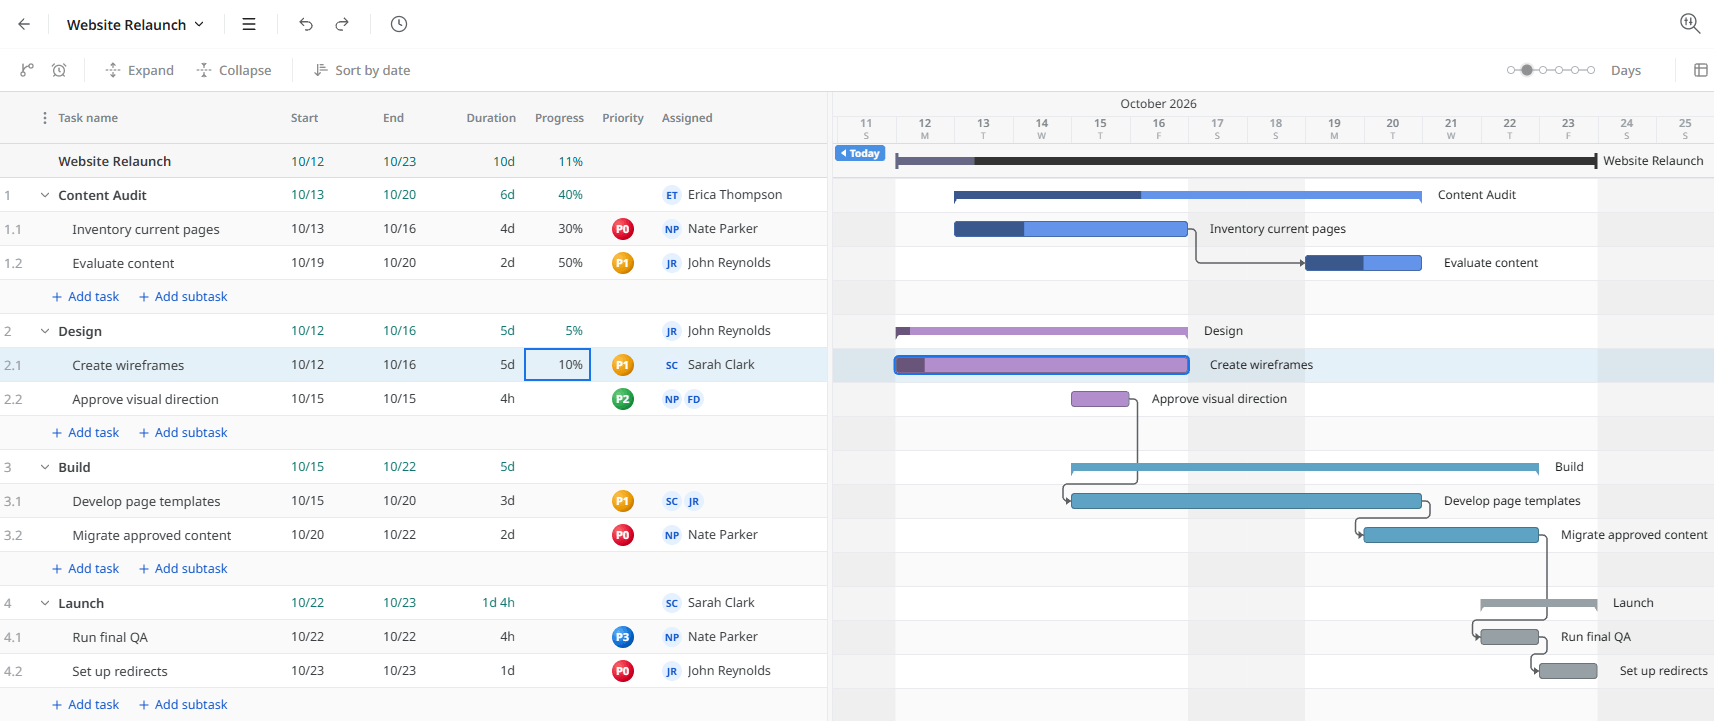
10. Export or print
When you need the plan outside Mindomo, export it to:
- PDF or PNG, for slides and reports
- DOCX
- Excel (“Gantt chart data”, with dates, progress and owners)
- Microsoft Project (.xml or .mpx)
PDF, PNG and print match the view on your screen, including the time scale, the columns and any collapsed rows. Print has a live preview where you set the paper size, orientation, margins and page tiling.
Save the export to your computer, Google Drive, OneDrive or Dropbox.
Other ways to start a Gantt chart
1️⃣ Import from Microsoft Project or Excel
If the plan already exists in Microsoft Project or Excel, import it. A Microsoft Project .xml file brings in the tasks, hierarchy, dates, % complete, notes, links and the calendar. An Excel import brings in the task hierarchy.
Imported links come in as finish to start. Check them after the import and change the type where needed, as in step 4.
2️⃣ Let AI draft the plan
Connect Claude, ChatGPT or another AI assistant to Mindomo through MCP. Ask it to plan the website relaunch. It can create and update tasks with dates, durations, owners, progress, priority and milestones. Then open the diagram as a Gantt chart and review the schedule.
If you are starting from nothing, the AI mind map generator can draft the brainstorm. You then schedule it as in steps 1 to 5.
Tips for a Gantt chart that stays useful
- Size tasks in days or weeks, not months. A task that takes three months hides its problems until it is too late. Break it up.
- Link tasks instead of typing fixed dates. Fixed dates go stale the first time something slips. Links move the plan for you.
- Set the working calendar before scheduling. Weekends and holidays change every date. Set them first, not after the plan is built.
- Tie each milestone to the tasks that deliver it. A milestone with no links is just a date on a wall. Linked, it shows the moment it is at risk.
- Update progress at least weekly. A chart that is two weeks behind is worse than no chart, because people stop trusting it.