This template allows you to plot and analyze information across two dimensions, using two distinct axes to reveal trends and relationships. Start by entering your data points along the horizontal and vertical axes. Use the chart to compare variables, track performance, or illustrate data trends clearly. Ideal for reports, presentations, and data analysis, this template provides a structured way to visualize and interpret complex information. What does the left/right position represent? What does the up/down axis on your chart represent? Add items or ideas to your chart, and consider where they belong on each the two axes. Drag and drop items to position them in the right place. What does your chart show? Type the title and press Enter. 思维导图可以帮助你集思广益,建立概念之间的关系,组织和产生想法。 然而,思维导图模板提供了一种更容易上手的方法,因为它们是包含特定主题信息和指导说明的框架。从本质上讲,思维导图模板确保了将特定主题的所有元素结合在一起的结构,并可作为个人思维导图的起点。思维导图模板是一种资源,可为创建特定主题的思维导图提供实用的解决方案,无论是用于商业还是教育。 Mindomo 为你带来智能思维导图模板,让你毫不费力地运作和思考。 您可以从Mindomo的商业或教育账户中选择各种思维导图模板,也可以从头开始创建自己的思维导图模板。任何思维导图都可以转化为思维导图模板,只需在其中一个主题上添加进一步的指导说明即可。2 axis chart
This template helps you to draw a 2-axis chart and evaluate ideas or items by two properties at the same time. For example, charting 'value' and 'risk' could help you decide what is the most important thing to do next.
The position of items or ideas shows important groupings and helps with prioritization.
Keywords: prioritization, ideas evaluation, task management, Planning & Organizing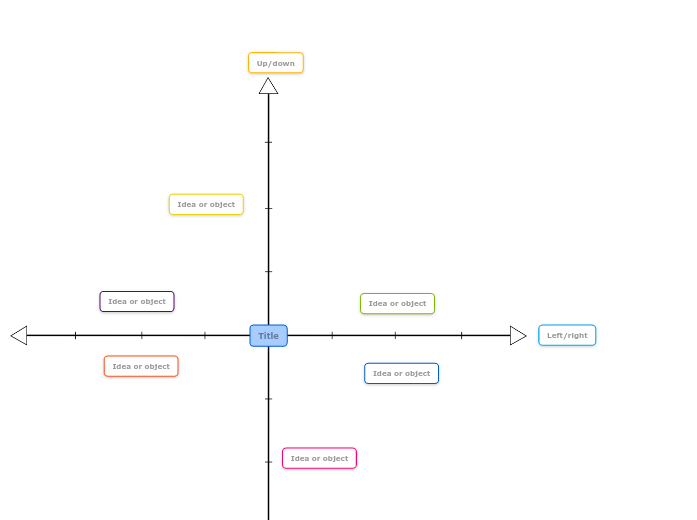
2 axis chart template
Left/right
For example, it might represent high value to the right, medium in the middle and low value to the left.Up/down
For example, items above the centre line can be high risk, and items below the centre line are low risk.Idea or object
Double-click to add new items or ideas.Title
For example, your chart might show how ideas are ranked by risk on the up/down axis and value on the left/right axis. This can help with decision making.为什么使用 Mindomo 思维导图模板?
模板具有各种功能:


