This template allows you to plot and analyze information across two dimensions, using two distinct axes to reveal trends and relationships. Start by entering your data points along the horizontal and vertical axes. Use the chart to compare variables, track performance, or illustrate data trends clearly. Ideal for reports, presentations, and data analysis, this template provides a structured way to visualize and interpret complex information. What does the left/right position represent? What does the up/down axis on your chart represent? Add items or ideas to your chart, and consider where they belong on each the two axes. Drag and drop items to position them in the right place. What does your chart show? Type the title and press Enter. マインドマップは、ブレインストーミング、概念間の関係の確立、アイデアの整理と生成に役立つ。 しかし、マインドマップのテンプレートは、特定のテーマに関する情報を含むフレームワークであり、ガイドとなる指示が含まれているため、より簡単に始めることができます。要するに、マインドマップのテンプレートは、特定のテーマのすべての要素を組み合わせた構造を確保し、あなたの個人的なマインドマップの出発点として機能します。ビジネスでも教育でも、特定のトピックに関するマインドマップを作成するための実用的なソリューションを提供するリソースです。 Mindomoは、スマートなマインドマップのテンプレートを提供します。 マインドマップのテンプレートは、Mindomoのビジネスアカウントや教育アカウントから選ぶこともできますし、ゼロから独自のマインドマップテンプレートを作成することもできます。どのマインドマップも、トピックの1つにさらにガイドノートを追加することで、マインドマップテンプレートマップに変換することができます。2 axis chart
This template helps you to draw a 2-axis chart and evaluate ideas or items by two properties at the same time. For example, charting 'value' and 'risk' could help you decide what is the most important thing to do next.
The position of items or ideas shows important groupings and helps with prioritization.
Keywords: prioritization, ideas evaluation, task management, Planning & Organizing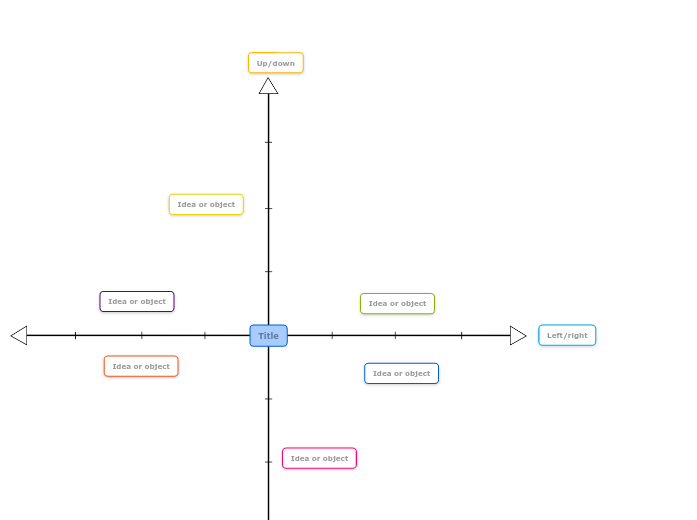
2 axis chart template
Left/right
For example, it might represent high value to the right, medium in the middle and low value to the left.Up/down
For example, items above the centre line can be high risk, and items below the centre line are low risk.Idea or object
Double-click to add new items or ideas.Title
For example, your chart might show how ideas are ranked by risk on the up/down axis and value on the left/right axis. This can help with decision making.なぜMindomoのマインドマップテンプレートを使うのか?
テンプレートにはさまざまな機能がある:


")
