

Mindomo Diagrams
44 articles in this category.
Latest Mindomo Diagrams
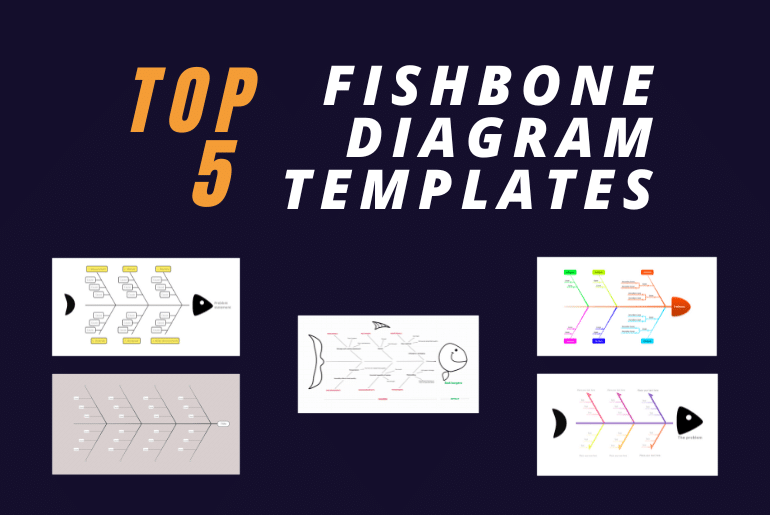
Top 5 Fishbone Diagram Templates You Need To Know About!
Five fishbone diagram templates for quality assurance, including the 6M and Ishikawa layouts in Mindomo, with how each one works and why to use it.
The Power of an Idea Map: Your Guide to Creative Thinking & Organizing Ideas
What an idea map is, how mind mapping differs from brainstorming, and five steps to make one, from a blank page to a map you share with others.
Read article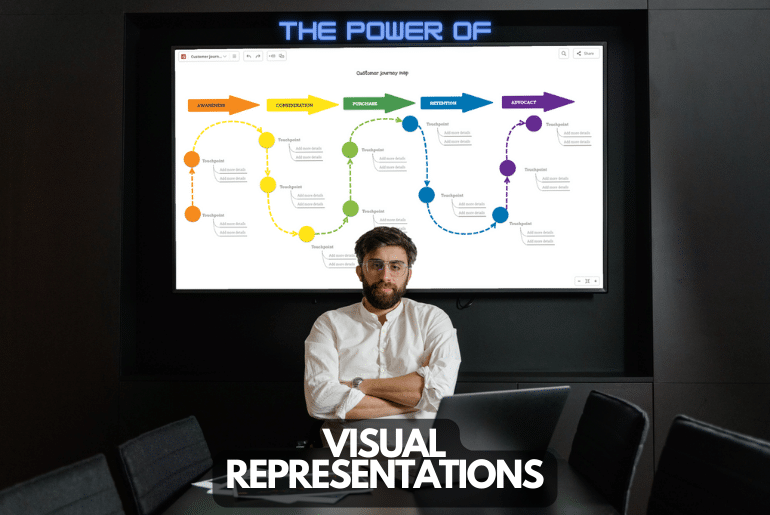
Visual Representation: What It Is, Types, and Examples
A visual representation turns abstract data into something you can see. What counts as one, the four main types, and where each one works best.
Read article
What is a Cluster Diagram? Visualize Relationships and Connections
What a cluster diagram is used for, its benefits for ideas and project planning, when to use one, and how to make one with mind mapping software.
Read article
What is a life map?
What a life map is and how to create one: reflect on past moments, current priorities and future goals, then lay them out as a timeline map.
Read article
How and When to Use an Argument Map?
What an argument map is, how to build one from a conclusion and the premises that support or counter it, and how it develops critical thinking skills.
Read article
Discovering the Power of T Charts: A Comprehensive Guide
What a T chart is used for, who benefits, its limits, how to make one and tips for using it, with examples from field trips to book characters.
Read article
Visual Diagrams: The Ultimate Tool for Idea Visualization and Planning
Visual diagrams explained: mind maps, flowcharts, graphs, fishbone and Venn diagrams, their benefits for planning, and how to create one.
Read article
The Best Ways to Organize Information Visually
How to organize information visually by location, alphabet, time, hierarchy or category, with maps, timelines, org charts, Venn diagrams and Gestalt rules.
Read article
A deep dive into a problem-solving mind map: The Dialog Map
What a dialogue map is, how Jeff Conklin's technique and IBIS diagrams help groups solve wicked problems, and its benefits in meetings.
Read article
All you Need to Know about the Bubble Map
What a bubble map is, how it differs from a double bubble map, how to build one around a central idea, and its uses in brainstorming and teaching.
Read article
15 Incredible Mind Map Uses
Fifteen mind map uses, from generating ideas and summarizing books to planning trips, writing a CV, learning a language and mapping a business structure.
Read article
What is a Customer Journey Map and Why is it Important?
What a customer journey map is, its five stages from awareness to purchase, retention and advocacy, and how to build one from a template.
Read article
What is an affinity diagram, and what does it entail?
What an affinity diagram is, from Kawakita's KJ method to grouping ideas by theme, with its purpose, examples for apps and meetings, and use in design.
Read article
Understanding What a Brace Map is
What a brace map (Warnier-Orr diagram) is, how it breaks an object down into its parts, how it is used in school and business, and how to fill one out.
Read article
The Power of a Funnel Diagram and its many uses
What a funnel diagram is used for, from sales pipelines on, and how to build one in four steps: categories, layers, combined data and color coding.
Read article