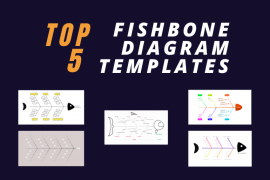
What is a fishbone diagram?
A fishbone diagram is a common name for an Ishikawa diagram or cause and effect diagram. Mindomo offers fishbone diagram templates in the library, making it easy to create your own fishbone diagrams.
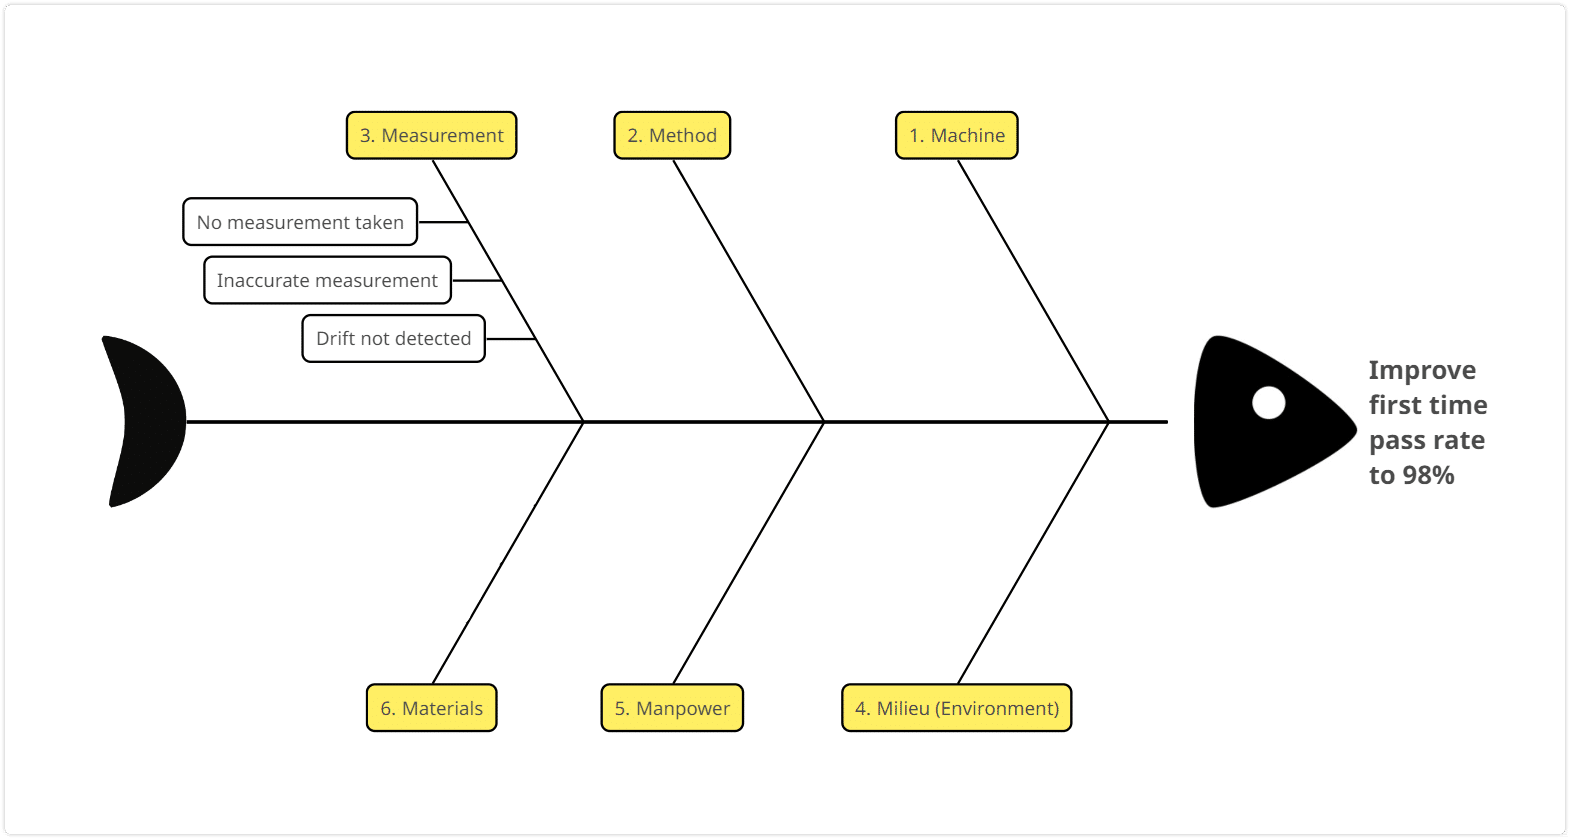
Ishikawa diagrams were popularized by Kaoru Ishikawa as a quality tool for problem solving. The head and spine of the fish represent a specific problem. The main ribs represent categories of causes. The smaller bones represent individual causes that contribute to the problem.
Showing cause and effect in a visual diagram helps to:
- Perform “Root Cause Analysis” on the causes of a problem, so that it can be properly resolved.
- Show that problems often have multiple causes, rather than a single cause.
What are the 4Ms in fishbone analysis?
You may have seen many different mnemonics associated with fishbone diagrams, such as “4M”, “5M”, “5M plus 1E”, “6M”, “8 Ps” and more.
These are sets of keywords to help you think about the causes of a problem. They are industry-specific and take various forms. For example, if you are facing a production problem, you might use the “6M” set, which suggests six categories of potential causes:
- Machine: defective machinery or equipment.
- Method: mistakes in the method or process.
- Measurement: errors made when taking measurements.
- Materials: defects in the materials used.
- Manpower: errors made by people.
- Milieu (environment): unexpected conditions such as humidity.
The 6M model is sometimes called “5M plus 1E” where “E” is the environment. Some variations include things like regulations and management.
The “8 Ps” model is designed to help analyze product marketing:
- Product or service.
- Price.
- Place.
- Promotion.
- People.
- Process.
- Proof.
- Performance.
There are other lists for troubleshooting service industries.
These headings are suggestions, not an exact science. You can start with one set and add or remove categories as you need. There are no right or wrong categories. You should ensure that you examine all potential causes of your situation.
The categories are there to remind you about the common areas. There will always be other factors to consider. The best set of categories is the one that captures your unique situation. A list from elsewhere will help you to get started, but only you can define the set that is right for you.
Is a fishbone diagram a mind map?
It is common to use mind mapping software to create fishbone diagrams. People sometimes wonder whether a fishbone diagram and a mind map are different things.
A mind map and a fishbone diagram have the same basic structure but are used for different purposes. Both are information drawn in trees starting from a single point.
In a mind map, the “basic ordering ideas” radiate outwards around the central subject and divide into more detail. A mind map is used to structure information and ideas that are related to each other. Mind maps can be used for studying, planning, writing documents, organizing information, and more.
A fishbone diagram also has a single central idea. This is the specific problem under consideration. The map around it describes the potential causes of that problem, and the causes of those causes. The first level of topics is used to group causes into high-level categories. A fishbone diagram is drawn with the fish head (the problem statement) on the right-hand side, and the skeleton on the left.
There is nothing magic about the shape. You could achieve the same results with a tree drawn in any direction. The benefit is that other people are more likely to recognize the purpose of a fishbone diagram.
When to use fishbone diagrams?
A fishbone or Ishikawa diagram helps to analyze and solve problems under certain conditions. It is important to use it in the right way for the best chance of success.
If the situation is chaotic, unpredictable, and outside your control, then your only option is to take action. You may need to protect things or move quickly on opportunities. Analysis may delay essential action.
If the situation that you are facing is escalating rapidly in real time, then the analysis will also cause a delay. You should take action to control the situation first, then understand it second. For example, your production line may suddenly start making bad parts. You may need to stop the line rather than continue to make more scrap while you analyze the details.
Analysis using a fishbone diagram is a good place to start if:
- The situation is normally predictable and under control.
- The situation is trending slowly, not escalating rapidly.
- There is no simple and obvious action to take.
- Actions that seem logical do not fix the issue or even make it worse.
If there is a clear and agreed connection between cause and effect, you don’t need to brainstorm causes before taking action. If your assumptions prove to be wrong, then you can proceed to fishbone analysis
How to create a fishbone diagram
A fishbone diagram is part of a process for solving a problem. However, problems are not solved by just drawing a cause and effect diagram. The diagram represents the thinking process and helps you to follow an organized approach.
Create a fishbone diagram starting from a Mindomo template
The Mindomo template library has several fishbone diagram templates. You can find them in the “Planning and Organizing” section of the template gallery, or by searching for “fishbone”.
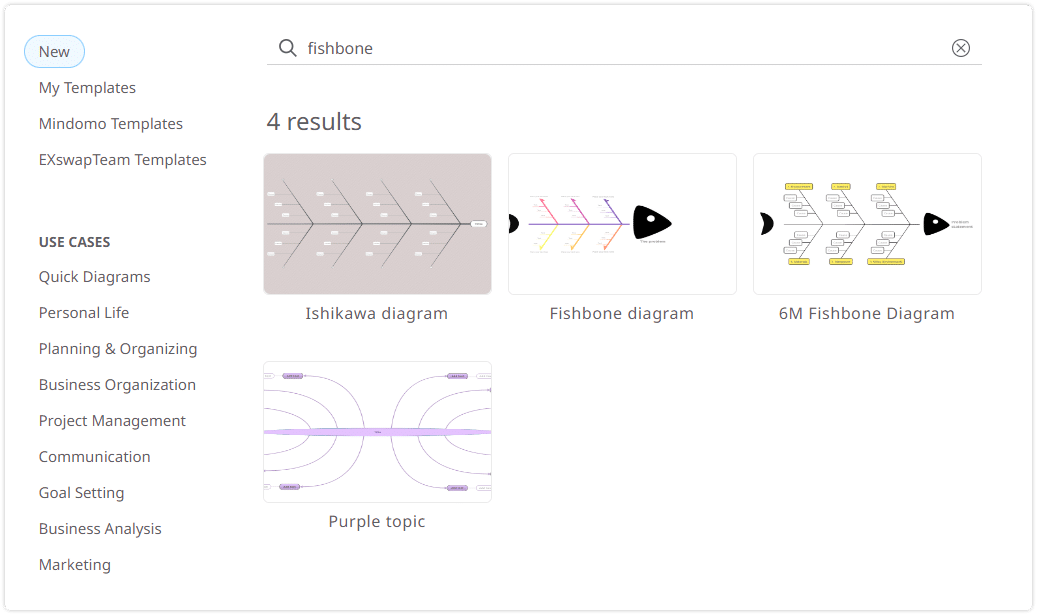
To create a fishbone diagram, simply click on the thumbnail in the mind map template library.
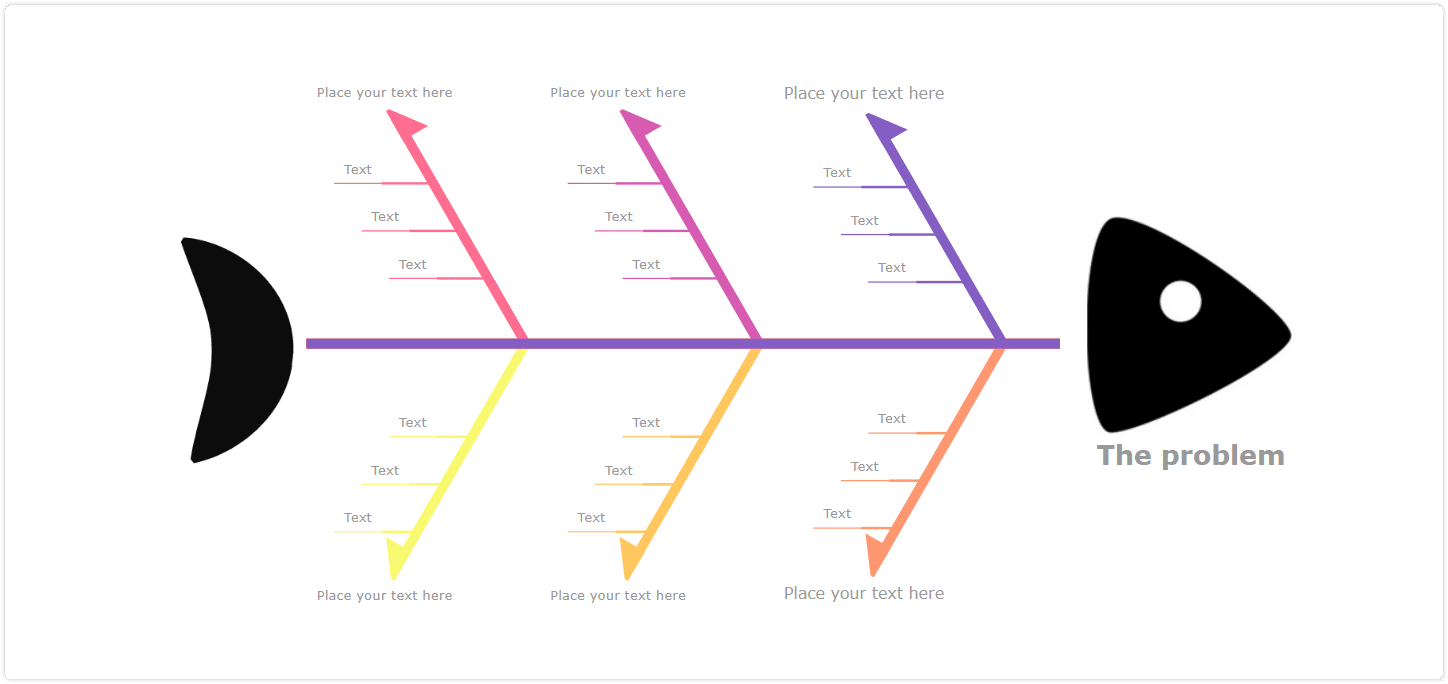
The Fishbone diagram template does not have any predefined headings, so you can add your own. It works best for small diagrams because it uses floating topics that need to be repositioned if you add a lot of topics.
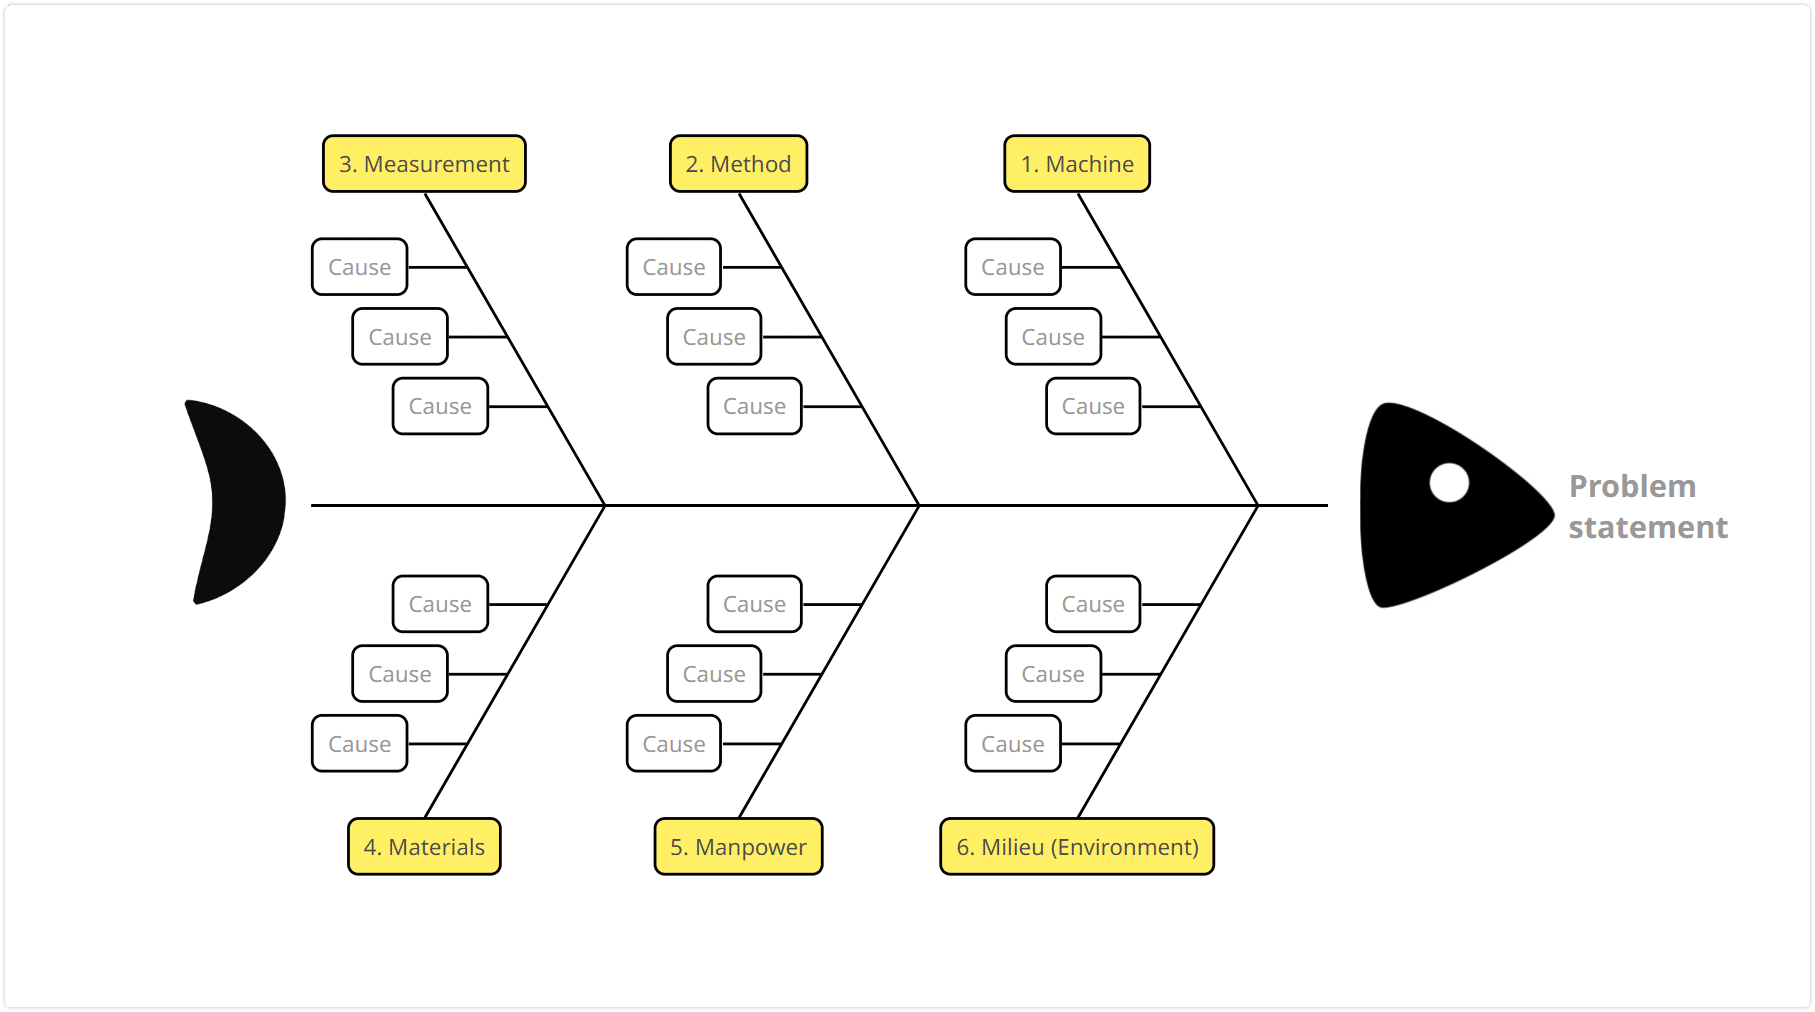
The 6M Fishbone diagram template contains the categories for a production issue. These are machine, method, measurement, materials, manpower, and milieu (environment). You can easily change these headings or add your own. This map is designed to scale easily, as it automatically changes the layout when you add more topics.
Clearly define the problem
Charles Kettering, the head of research for GM, said “A problem well stated is a problem half solved”. Clearly describing the specific problem shapes everything that follows.
First, make sure you are solving the right problem and not a symptom of something else. If this issue affects other people, make sure they agree with the problem statement. Then they will support the effort to solve it.
Describe the problem in a single sentence. Try several ways to write this and choose the one that everyone agrees is the clearest. If the problem is well described, it may give clues about where solutions lie.
Lastly, write the problem statement as a question. This helps to focus on what you aim to achieve. For example, instead of writing “Sales are too low”, write “How can we increase sales by 50% this year?”
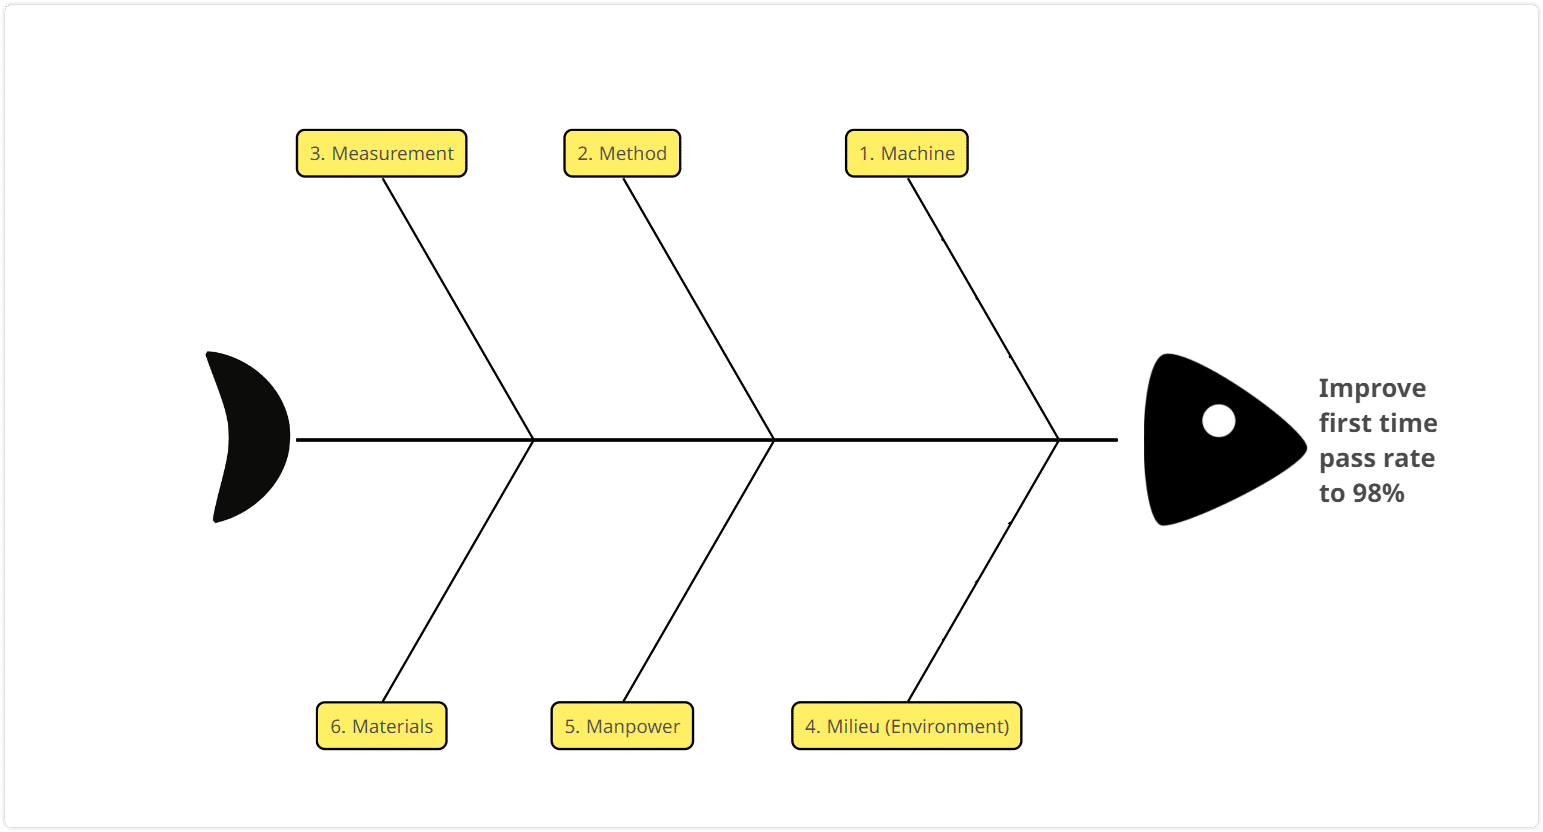
Enter the problem statement into the central topic, so that it is clear for everyone to see.
Add your categories
The next step is to add the categories for your fishbone analysis. These are headings or groups of potential causes for the problem.
An initial set of categories may be present in the diagram template. You can change them or add more as needed. It may be a good idea to add a category called “Other”. This reminds you that there may be other places to look for potential causes.
Develop potential causes
The process for creating a fishbone diagram uses Root Cause Analysis. It starts with the assumption that at some point in the past, things were acceptable. This is your known reference point. Then an event or change occurred, leading to a problem or issue. The change is the “root cause” of the issue. If only one change led to the problem, then there may be only one root cause.
The process of collecting possible causes benefits from the input of others. You should run a brainstorming session about potential causes across the team or stakeholders. You may get some very different ideas. Different people interpret the same things in terms of their personal expertise and perspective. This is especially true of complex problems, where everyone has a favorite target. Marketing blames the sales force, sales blame the product, production blames suppliers, and so on.
The reality is that there is often no single root cause behind complex problems. If things were always that easy, then problem solving would not be difficult. The cause is often a combination of conditions that interact with each other. For example, production might fail when a component is at the limit of tolerances and the bowl feeder is full to the top.
Separately, these causes do not create an issue. A problem only occurs when they happen together. It can be hard to identify the root cause here. Analyzing each cause on its own will not reveal it. Looking for a single root cause will not solve it. You need to use your fishbone diagram to look for combinations of causes.
Carry out Root Cause Analysis
The author of “Sherlock Holmes” books, Arthur Conan Doyle, said, “When you have eliminated all which is impossible, then whatever remains, however improbable, must be the truth”. The next step is to begin a Root Cause Analysis, looking for the cause or causes that lead to the problem.
When looking at each cause, think about the following:
- Do the symptoms suggest that there is a defect in this exact area? What evidence would you expect to see if this were the cause? If there is no supporting evidence, you may be able to eliminate it early. Is there any contradictory evidence? Eliminating potential causes is a useful step. You may also later realize you have eliminated something by misunderstanding the symptoms. If you have written down your thinking, you can always go back and review it again.
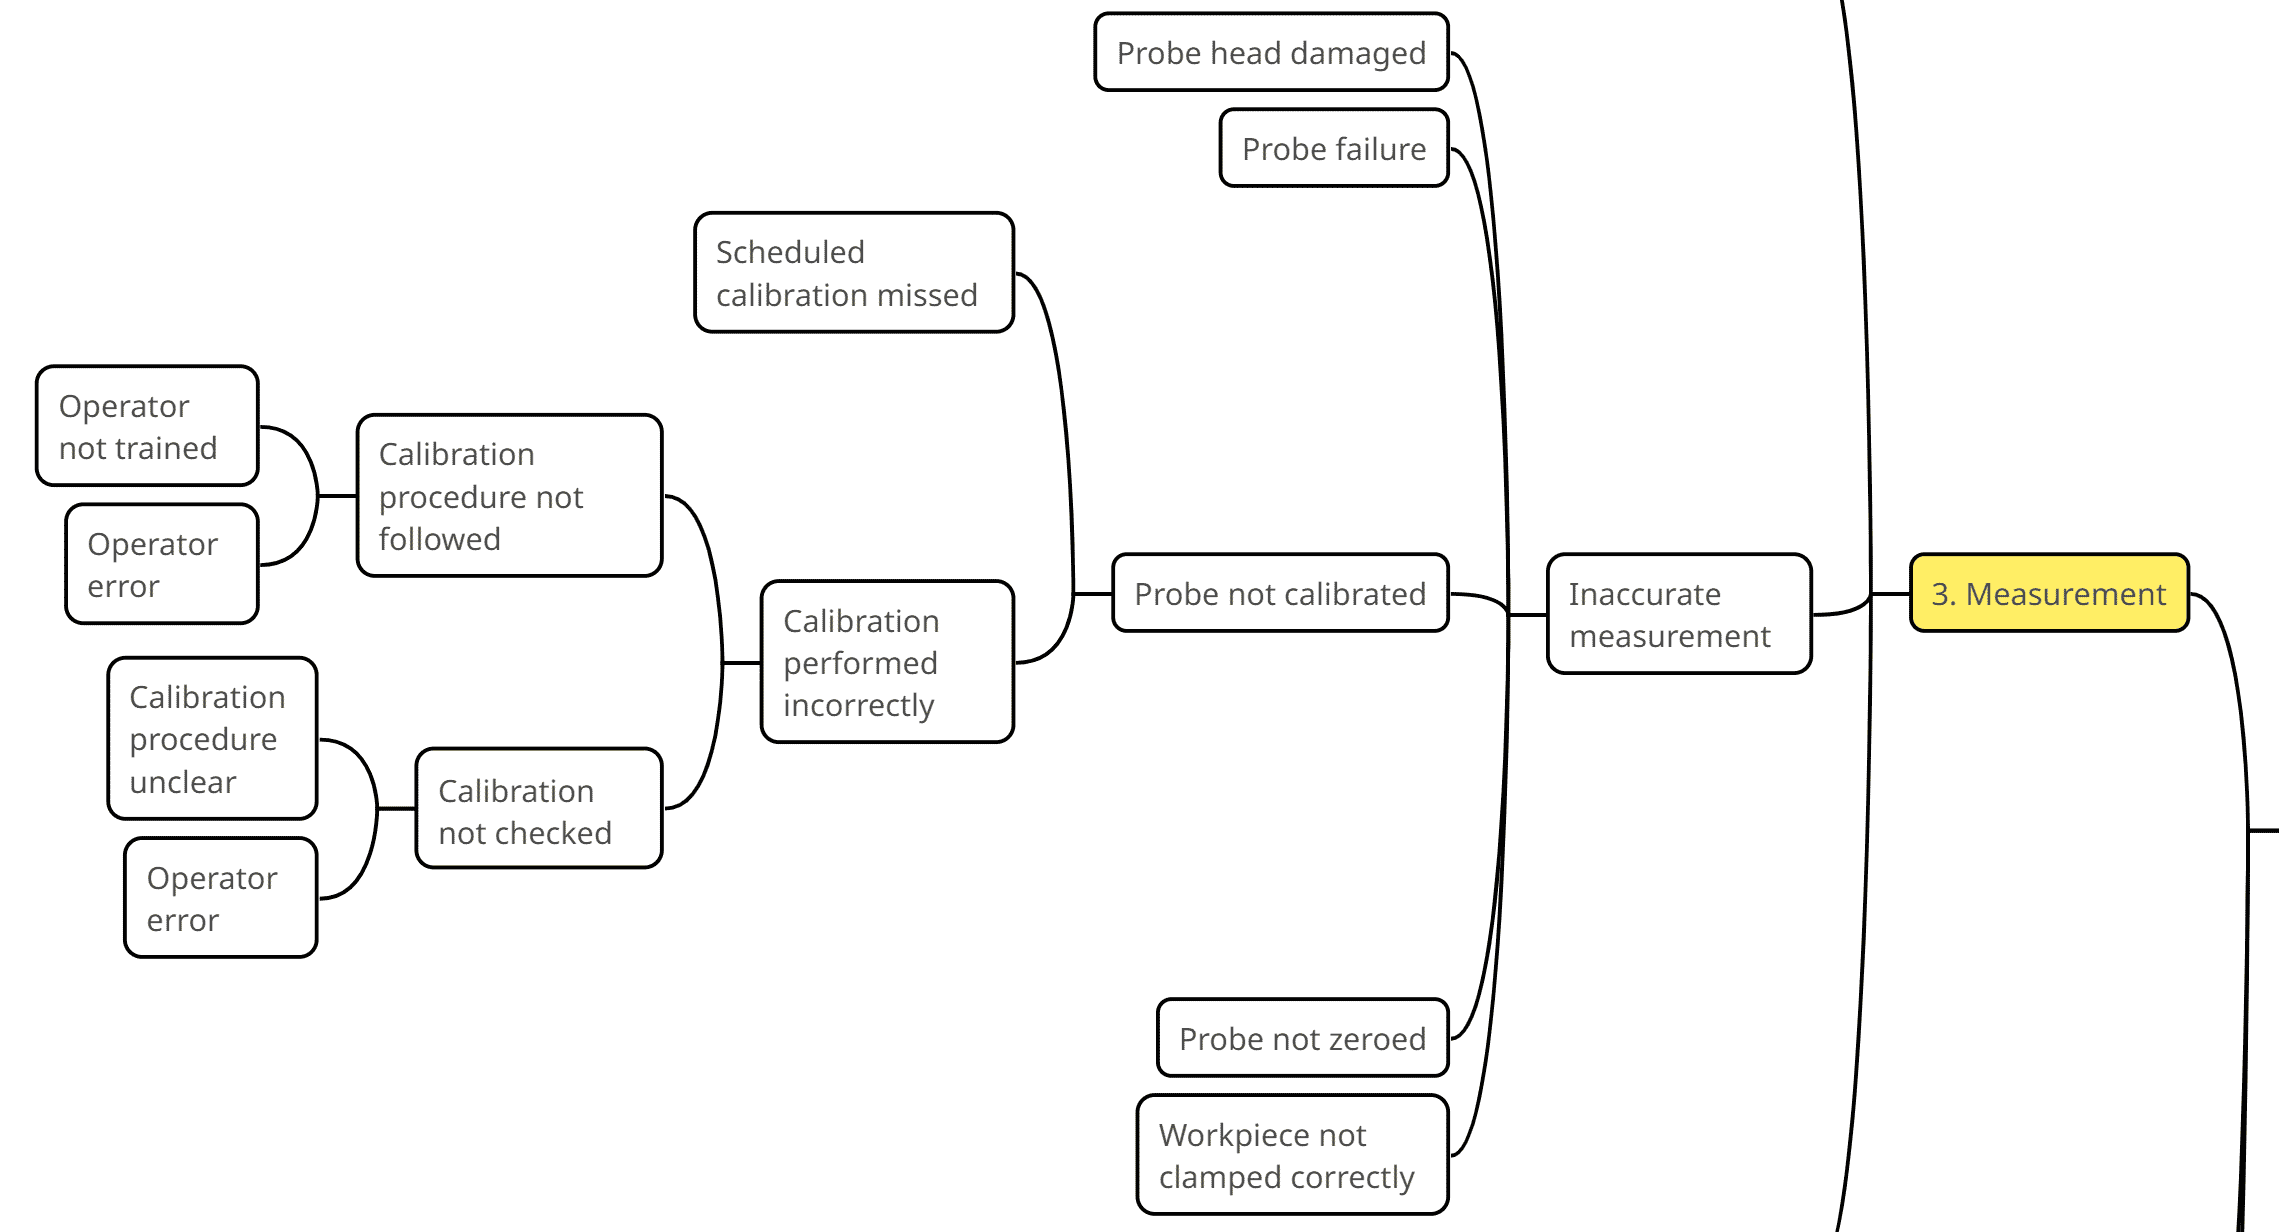
- If this is a potential cause, use the “5 Whys” method to explore it. Why is it happening? Keep on asking “Why?” until you can identify the original change that has taken place. A Mindomo map is the perfect place to capture ideas and thinking in this way.
- Remember that causes will influence each other. Think about what needs to be true for this cause to be the actual cause. What assumptions might you be making? Does your logic mean ignoring some evidence? Is important evidence missing? What else might be happening that is not obvious?
- Sometimes, causes may fit under more than one category. For clarity, you can list them in more than one place and draw a relationship on the map to remind you that they appear more than once.
What happens if you can’t identify the root cause?
If you cannot identify the root cause of a problem, then one or more of the following may be happening.
- The problem statement in your fishbone diagram is not precise enough.
- You are missing some causes in your cause and effect diagram. Review it again with other people to think about what else could be happening.
- The evidence is not accurate, or something has been left out. People sometimes “forget” things that might make them look bad. They might not mention that the equipment developed a fault only after it was dropped on the floor.
- You are misreading evidence and symptoms. This is very easy to do, especially when you think you know where the fault lies. You tend to focus on information that supports your theory and ignore the rest.
- You might not have an accurate model of how the symptoms work. You may have eliminated a potential cause because the expected symptoms were absent. If it fails in a different way to your expectations, you might eliminate a relevant cause. Work through the causes again to be clear about their effects and write down what you expect the effects of each to be.
- The root cause is a combination of conditions, not a single cause. Look again at the evidence and consider whether it suggests more than one cause. You might be neglecting some evidence as a mere coincidence. If the system is very complex, consider drawing a Concept Map (find out what is a concept map) to help understand it.
Verify your analysis and start work on solutions
Hopefully, you can find a root cause or causes by matching them up to the evidence.
When your fishbone diagram is complete and you have a theory for the root cause, verify it against all the evidence. You might need to collect more evidence to prove or disprove your theory.
An important outcome of Root Cause Analysis is to understand the causes of the problem well enough to anticipate other problems and prevent them. Fixing the immediate problem is important. Preventing future problems is equally important.
You may be able to make small changes to test your theory. If you do this, make sure you change only one thing at a time. You can then observe the effects of a single change. People often address complex problems by making multiple changes at once. Sometimes, the changes mask the original problem and replace it with a set of different issues. Things change, but not always for the better, and no learning takes place. You will never know whether your analysis was right if you make several changes at the same time.
Other ways to use fishbone diagrams
Although cause and effect diagrams are usually described as a problem-solving tool, they can be used in other ways.
There is no need to wait until a problem arises before thinking about the root causes. You can create a fishbone diagram for the possible causes of any problem. This can be used to improve designs and prevent problems before they occur.
For example, if you are responsible for product design, you could draw a fishbone diagram of the causes of future problems. Then you could take some action now to reduce the most likely causes. Or, if you have already drawn the fishbone diagram for a marketing function, you will be ready to respond to an unexpected issue, without needing to brainstorm causes.
You can also use a fishbone diagram to help understand the causes of success as well as failure. Drawing a fishbone diagram of successful tactics will help to identify the activities that led to success. You can then strengthen these and make sure they are used more.
Why use Mindomo for fishbone diagrams?
You could draw fishbone diagrams on paper or use a whiteboard with your team to get started. But creating fishbone diagrams with Mindomo has many advantages.
- You can easily collaborate with remote users in real time. Brainstorming causes is the starting point for fishbone diagrams. More input and ideas from a range of people increase your chance of finding a root cause.
- You can easily reorganize the diagram. Simply click and drag ideas and information to a better place on your map. You can also easily add a new category.
- You can capture all the thinking behind the “5-Whys” analysis of each cause. The diagram can grow very big when you start doing this. A Mindomo map will expand to capture all your ideas without needing to be redrawn.
- You can use icons to mark topics and filter the map to focus on just these. For example, you could put an icon on everything linked to suppliers. These may be spread across different parts of the diagram.
- You can embed useful documents or link to helpful resources from your fishbone diagram.
- You can assign actions to people. Your fishbone diagram can become a plan for action.
- You can quickly search previous diagrams for related information when looking at a new issue.
- You can make a copy of a diagram you already prepared to deal with a new issue.
Keep it smart, simple, and creative!
Author: Nick Duffill