While it may roll off the tongue well, a double bubble map is one of the eight thinking maps out there. Thinking maps, in general, are an excellent strategy to master. It’s primarily used in early education throughout high school as a way of visual learning. The various types of thinking maps that are used all have their own unique strength for generating ideas. A thinking map is used to break down complex situations and ideas. They are meant to have people brainstorm their way to a clear understanding of the core ideas. That makes them a great brainstorming tool.
You can use them to help teach any type of subject, from history to math. Then, when fully mastered, you can use them in an adult setting to help compare and contrast.
Out of the eight thinking maps out there, there are two main types of bubble maps. First, there is the thinking map with only one core topic, and this is where bubble maps are used.
Then there is the thinking map with two different concepts and where it’s time to compare and contrast.
In general, thinking maps are the first level of mind map examples out there.
How does a double bubble map work?
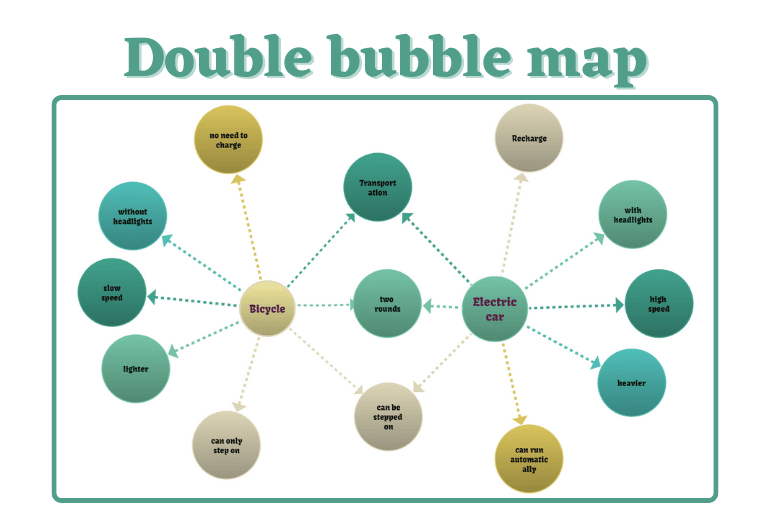
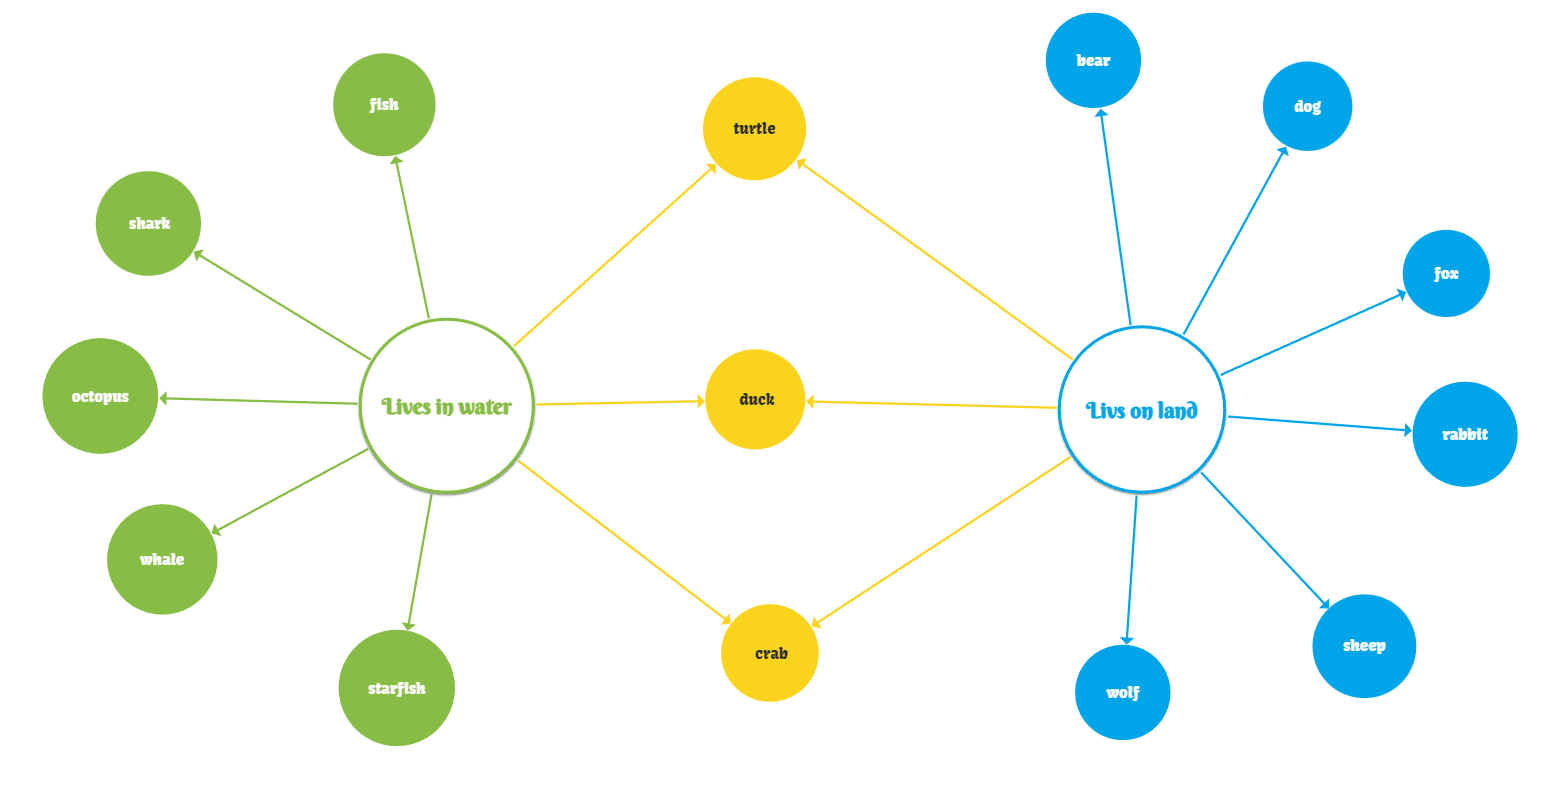
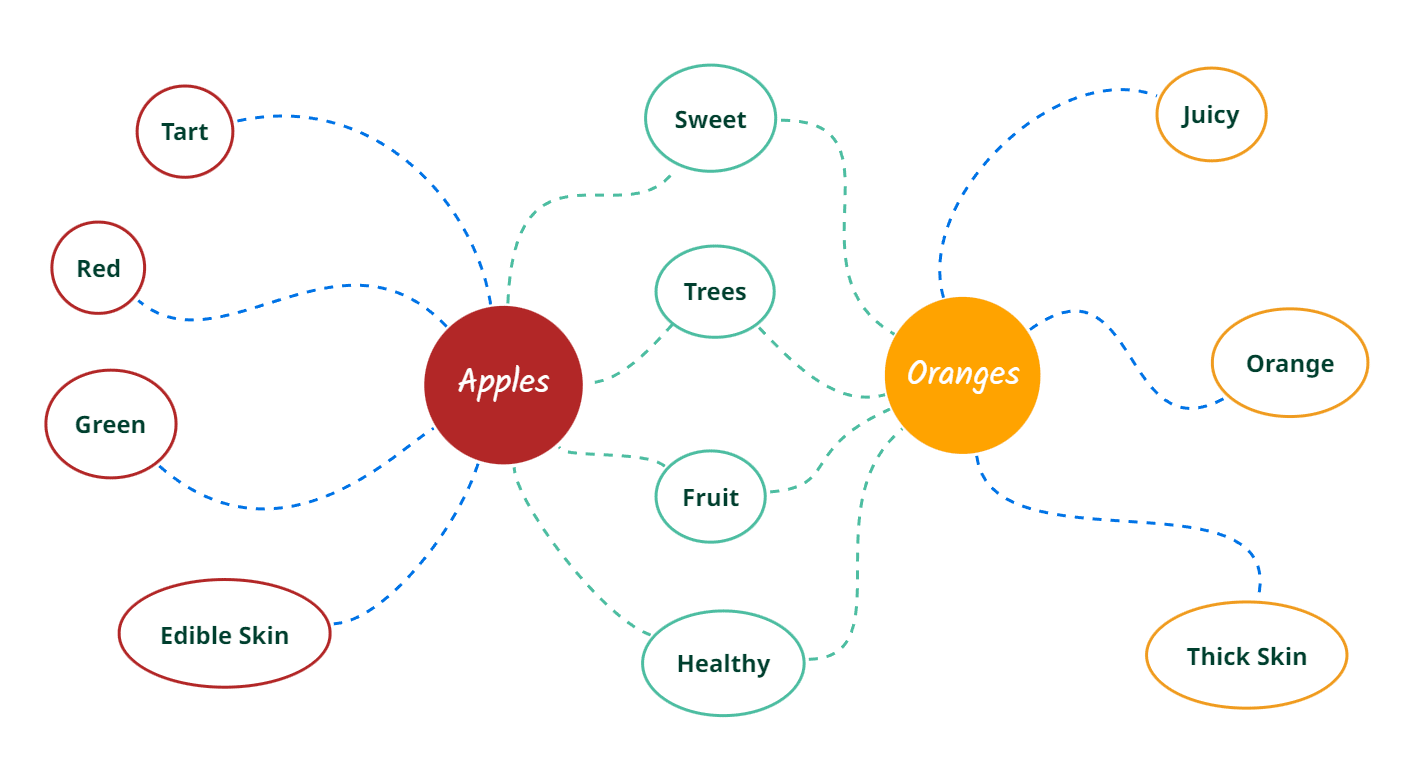
A double bubble map starts with two big circles. These two ideas, things, or concepts are up for comparison. Then it’s all about finding those items that relate to both concepts and including those pieces where these two topics tend to clash. The items or ideas that are similar would typically go between the two bigger circles. Any items or ideas that only relate to one of the topics would go on the outside of that bubble.
This is how a double bubble map ends up being an excellent graphic organizer to compare and contrast with. To complete the entire double bubble map, it’s encased in a rectangular frame. This frame is a place to put sources or to give a title that takes a specific viewpoint. It’s not always necessary for this rectangular frame for this type of graphical organizer though.
Difference between a bubble map and a double bubble map
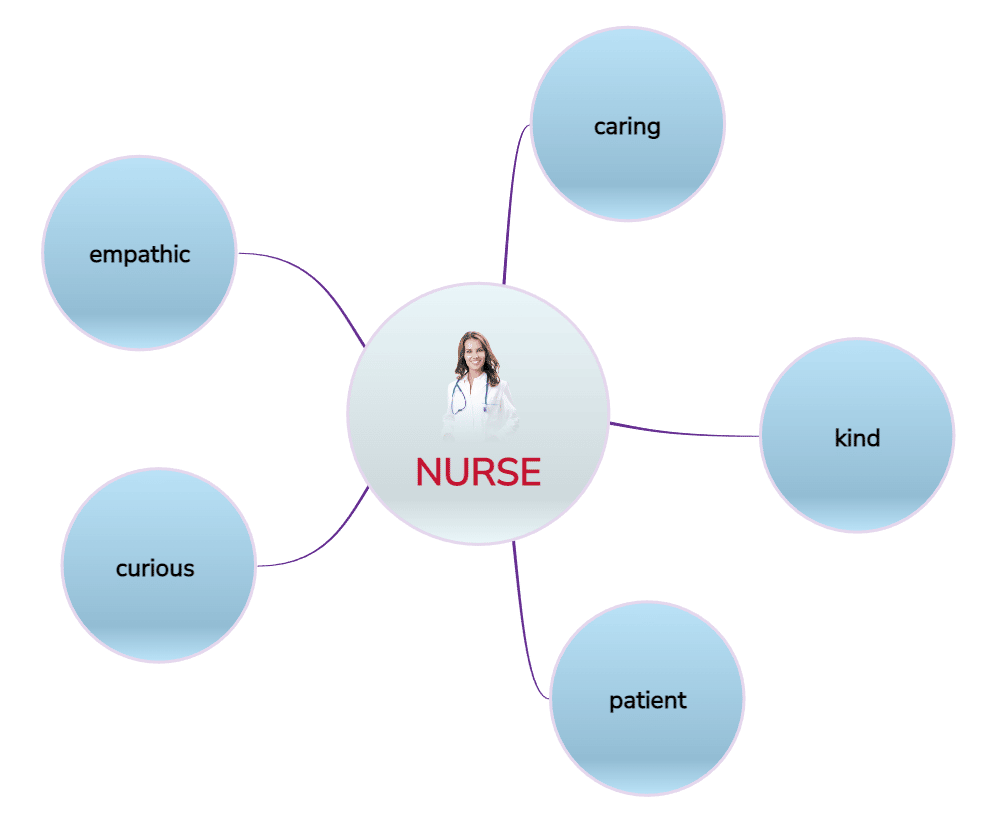
Sometimes people may think that these are interchangeable as a type of graphic organizer. Yet, in reality, bubble maps are very different from double bubble maps. Bubble maps tend to have only one key topic in the center, and it’s about vocabulary expansion. It’s a way to effectively describe the topic, person, place, or idea in the middle bubble. Where applicable, they’re meant to use all five senses in the description.
This way, a deeper understanding of what’s in the big bubble of these bubble maps can happen. Bubble maps can be expanded to use scientific topics and break down ways to describe them simpler. The descriptive bubbles themselves don’t get their own smaller bubbles to expand those individual adjectives further.
A double bubble map is all about comparing and contrasting two topics. The topics don’t even need to be remotely relatable, and that’s where the power of bubble maps would come in. Double bubble maps, as one of many examples of mind maps, are similar to a Venn diagram. It actually expands on the use case of a Venn Diagram, which itself can be limited. Venn Diagram shows the logical relationship between the two themes.
They don’t expand into various categories that a double bubble map can. They do compare and contrast, but it’s simply what’s in the overlapping circles and what’s on the outside. Double bubble maps can be color-coded and have different types of notations to help make them complex if necessary.
Why to use a double bubble map?
Double Bubble maps are both flexible and simple in their usage. They are only there to compare and contrast two topics, no more and no less. They bring a focus to these two topics, and again that can be about any topic. Double bubble maps also reinforce visual learning, which is the more common way for people to learn from.
The best element is that you can make this type of mind map online, so the work gets saved and be referenced later. Double bubble maps are not meant to be used and built out once. They can be used for several teaching sessions and be expanded upon. They can also be a place to collect all the thoughts in one place, as is common with a graphic organizer. Once the right double bubble map is used, it remains as that reference point to compare and contrast.
Here’s a simplistic example of a double bubble map that is comparing and contrasting apples to oranges.
Is making this kind of map hard?
The best way to start is by using a digital graphic organizer or diagram software. This allows you to practice and generate ideas while easily being able to edit this online. Using tools that may come with other mind map examples is also best. This helps to give you a better idea of how to build it.
Mindomo is an excellent diagram software that can help you build double bubble maps. You can work straight off of a template or go the blank canvas route with a blank mind map. The options are limitless, and as always, Mindomo starts out free until you need to expand the number of mind maps you need and how many templates you want to use.
Otherwise, there’s no reason for you not to start making your double bubble map today. You’ll quickly be able to see how fast and intuitive you’re able to compare and contrast. You’ll even be able to share these double bubble maps and invite collaboration to build them out further.
Then you can see how to use this in classroom teaching. It also works if you’re looking to handle some independent learning yourself. We feel that there are enough examples out there we have provided and simple yet elegant functionality to get you a slew of mind maps set up in no time.
Keep it smart, simple, and creative!
The Mindomo Team

