Decisions about what to eat for dinner or which shirt to put on in the morning do not require a logic chart (also called flowchart diagram) or any formal process whatsoever. Personal taste and temporary whims help you with most choices throughout the day. Things that affect your education, career, or business process need more structure and logic involved. With the help of a mind map tool or flow charts, you can narrow down the possibilities and come to the right conclusion for anything that really matters to your life.
How Do People Make Decisions?
The answer to this question is not as straightforward as it seems. The importance of the decision frequently defines the method used to make it. Obviously, people are not going to put as much thought and consideration into choosing a meal as they would for a career change. For good or ill, most decisions are fueled by emotions. To get scientific, this is a combination of the stimulus/reward cycle that makes our brains seek out pleasurable things.
Desire fuels decision-making. Unfortunately, this does not work out well in the end in many cases. Pulling data into the mix helps. What really makes a difference when it comes to making important decisions in life is having a set process map that takes everything into consideration and provides a logical path forward. A Mindomo logic chart does exactly that if set up correctly and in an organized way.
What Are Logic Charts?
Do not confuse these with logic diagrams specifically used in computer programming and engineering projects. Logic charts are amazing tools for business and personal decisions that require careful consideration of all the steps in a process. When you map all possible points that go into a decision, you are better equipped to come to the most logical and beneficial conclusion.
Creating Flowcharts for Logical Outcomes
To create a logic chart, start by identifying the main issue that you have to make a decision about. Then, define the possible outcomes. Should you go back to university or change your career path? Is it a good idea to move your mother-in-law into the spare bedroom? Does it make sense to expand into a new market with your small event planning company? These types of questions and yes/no answers are suitable for one-time use. A basic flowchart works well in most cases.
These types of flow charts also help you organize your thoughts into steps, and then in a process in order to make a decision for issues that arise more than once.
You can use a flowchart template like the one below to create a logic chart that leads you from any question to the best outcome.
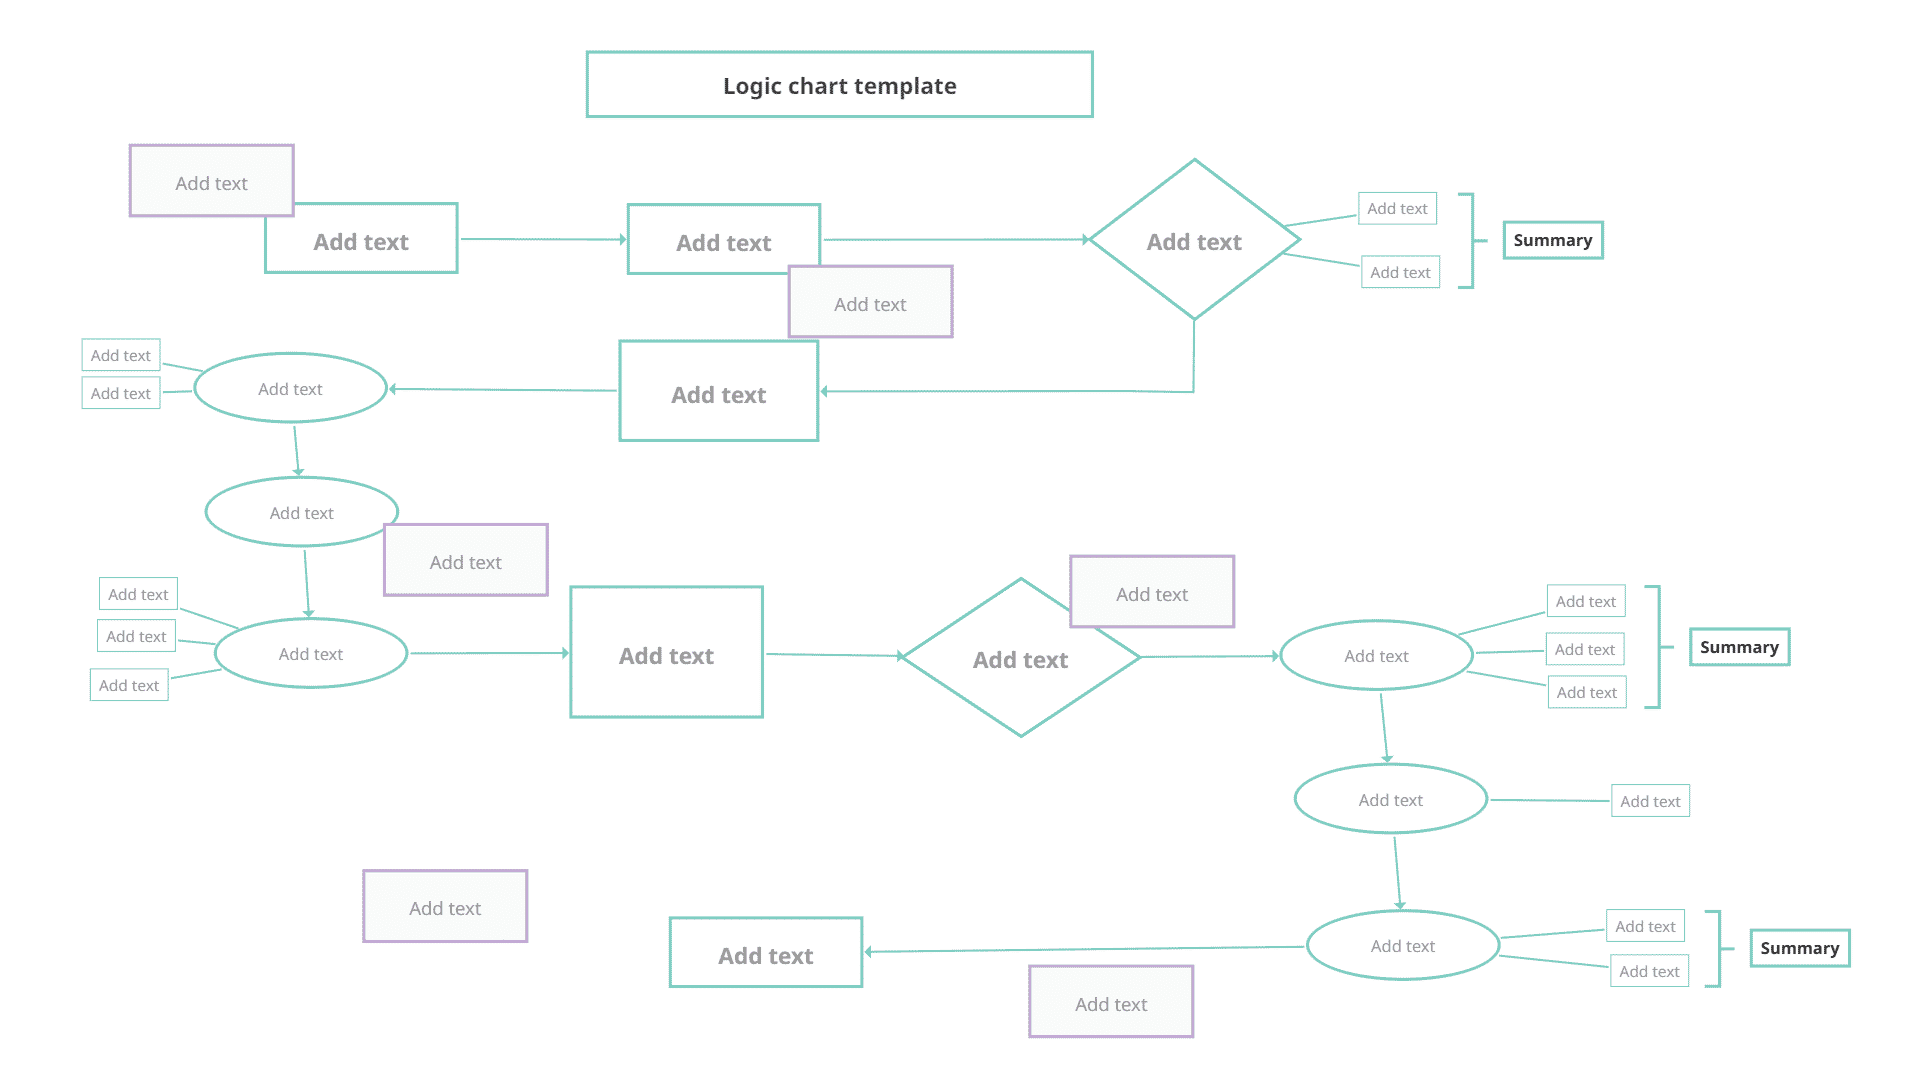
Of course, creating functional flowcharts with a tool like Mindomo allows you to self-directed the process as well.
How to Build a Logic Chart?
Step 1: Start with the primary question
What will be this logic chart all about? What is the dilemma you’ll have or the problem you want to find a solution for?
Step 2: List all possible final decisions
Make a brainstorm with all the possible outcomes. Add the positive and negative ones, and write anything that crosses your mind using your imagination.
Step 3: Use the power of visual representation
Now it is time to create the logical process that will lead you to the right decision. You can use any rectangles, diamonds, small circles, or other shapes with directional arrows to keep the process map organized.
Step 4: Make a list of questions and considerations that have to do with the decision at hand.
Every time you add an emotional element, point the arrow to a more logical option. Include any decisions that need to be made along the way. Remember, the goal of creating flowcharts is to create a simple process flow. You should not get hung up on any one step so that you cannot move forward.
Another option is to make a basic flowchart for decision-making that can be used for any question. Instead of listing specific elements or questions pertinent to a single idea, create a series of steps in a process that applies to any. This is more difficult than a specific chart because every question asked about life has different possibilities and considerations. It may take a lot of time to perfect the contents of each square or small circle, so it is understandable and leads to the right conclusion.
Why is a logic chart a great solution for decision-making?
A basic flowchart diagram focused on logical outcomes could include some of the following questions:
- Is there any data to back up this decision?
- Was the outcome of similar decisions in the past positive or negative?
- Are there any external factors influencing the decision?
- Is the risk greater or less than the reward?
- Would I recommend this decision to a family member or friend?
Another reason this type of logic chart takes longer is that it is difficult to divorce emotions from human thought processes. A logic chart that follows specific steps in a process may not be easy to create. This is especially true when the outcome affects your life in a very serious way. No one wants to make a mistake when their job and income are at risk. Feelings in view many big choices, especially when they affect the family. Even the most data-driven business plans can run afoul of emotional thinking at times.
By creating flowcharts and using tools of quality like Mindomo’s extensive features (and flowchart templates), it is possible to operate within the bounds of logic more frequently. In many ways, these types of personal logic charts are very similar to those used by computer programmers, engineers, and technical project leaders. Instead of working with system algorithms and team processes, you are working with the mental processes that affect your life path. Every decision still comes down to weighing options, considering data, disallowing emotional influence, and following a logical path of questions and answers to the best outcome possible.
Logic charts define and clarify processes for business and personal projects. They help you make decisions based on more than temporary feelings or general interests. Best of all, you can use these flow charts again and again to get the best outcome for a specific instance. The input/output correlation remains flexible depending on whatever factors affect the decision itself. Whatever the case, rest assured that you will get the most logical and practical solution each time you follow the flowchart process.
Keep it smart, simple, and creative!
The Mindomo Team