Life is filled with decisions. Will it be toast or cereal for breakfast? Will you go to college or immediately look for a job? Will you market your product to this niche or that one? Will you follow this philosophy or that religion?
While Venn diagrams won’t make these decisions for you, they can make it easier for you to make them. They give you the ability to compare and contrast two or more things. This allows you to understand your decision more holistically. And that gives you the power to make a better-informed decision.
If it’s been a while since you were in high school, you may have forgotten all about Venn diagrams. Many people do. That’s unfortunate since they’re useful for far more than comparing literary themes or species of animals.
So, before we get into these practical, real-world Venn diagram examples, let’s take a quick refresher on the subject.
What is a Venn diagram?
Originally conceived by the logician John Venn, these graphic organizers show the logical relationship between two or more items. He used them to teach basic set theory. However, he didn’t name them after himself. These graphic organizers became known as Venn diagrams when Clarence Irving coined the term in his book, A Survey of Symbolic Logic.
However, that’s only one of their benefits. They’re also a fun way to think outside the box and explore the similarities, differences, and overlaps between topics.
A Venn diagram typically consists of two or more overlapping circles, illustrating how two ideas might be compared or contrasted. They offer a diagrammatic and mechanical representation of these concepts that’s easy to understand. The great part about it is that circle Venn diagrams are incredibly simple to construct. All you need is a pencil and some paper to draw a Venn diagram. But if you want to make the most of creating a Venn diagram, using diagram software is even better.
From math and science to business and creative fields, Venn diagrams can be used in all sorts of exciting ways. They can be used for everything from analyzing population-level data sets to identifying shared attributes between two objects. A Venn diagram can even be used by artists as a brainstorming tool to generate new ideas. These versatile diagrams may just be the answer you need. Whether you’re a student studying or an entrepreneur who needs new ways to address a problem, Venn diagrams can help.
What About Euler Diagrams?
Most people are familiar with Venn diagrams. Fewer have heard about Euler diagrams or their inventor, the Swiss mathematician Leonard Euler. Euler diagrams are similar to Venn diagrams in many ways, including their overlapping circles. Though they do differ in one main way. Venn diagrams show the relationships between a collection of sets comprehensively. Euler diagrams, on the other hand, only show the relationships that actually exist in the world.
Because of their similarities, these two kinds of diagramming tools can be used in many of the same scenarios. But it is important to be aware of their differences.
Now, we’ve got a handle on what the terms Venn diagram and Euler diagram are. So, it’s time to examine some real world applications.
Venn diagram examples and use cases
Now let’s see 10 specific circumstances when you can use Venn diagrams:
1. Use a Venn Diagram to Fine-Tune Your Hiring Process
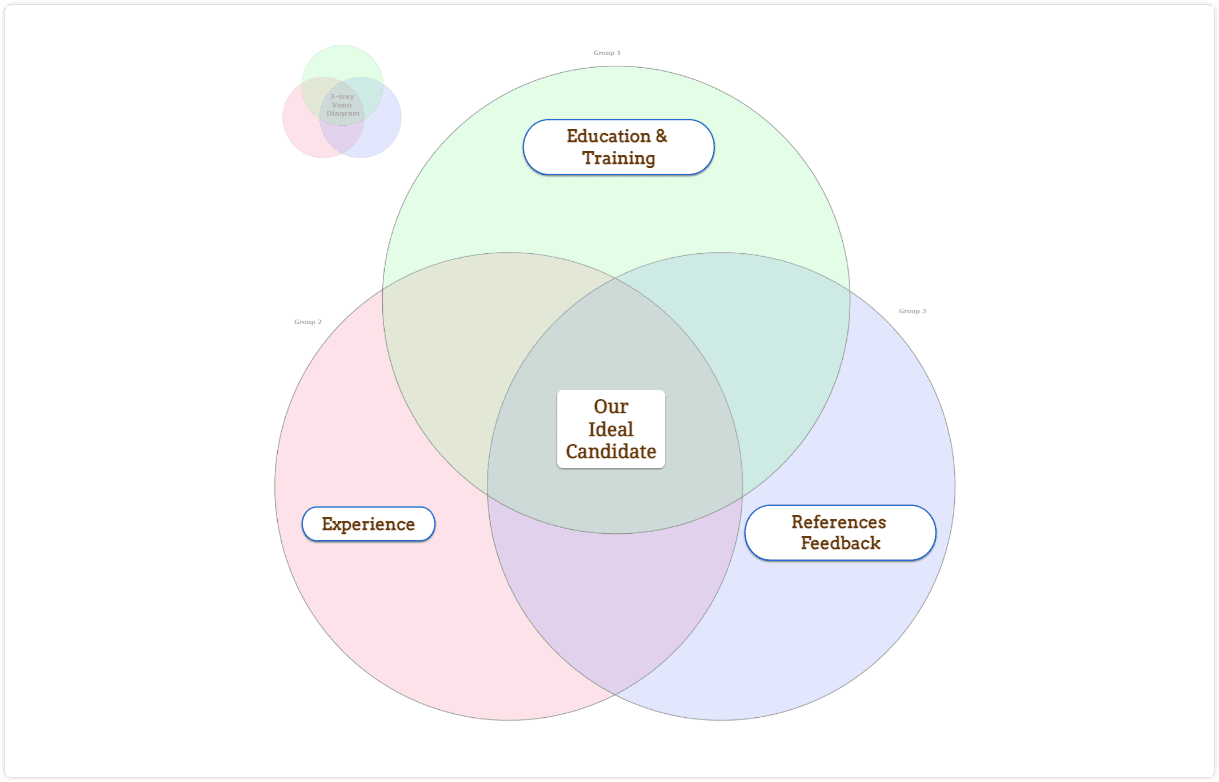
Venn diagrams can make the process of hiring new employees more efficient and streamlined.
You can use a Venn diagram to help figure out which applicants are most qualified for the job. How? By quickly sorting through their resumes and highlighting the skills or experiences that meet your requirements.
For example, you may have one circle labeled ‘training.’ Another can be ‘experience.’ Still another may be ‘culture’ or something similar. Once you’ve set your diagram up, you can place each of your applicants where they fit in the mix.
2. Use a Venn Diagram for Computer Science
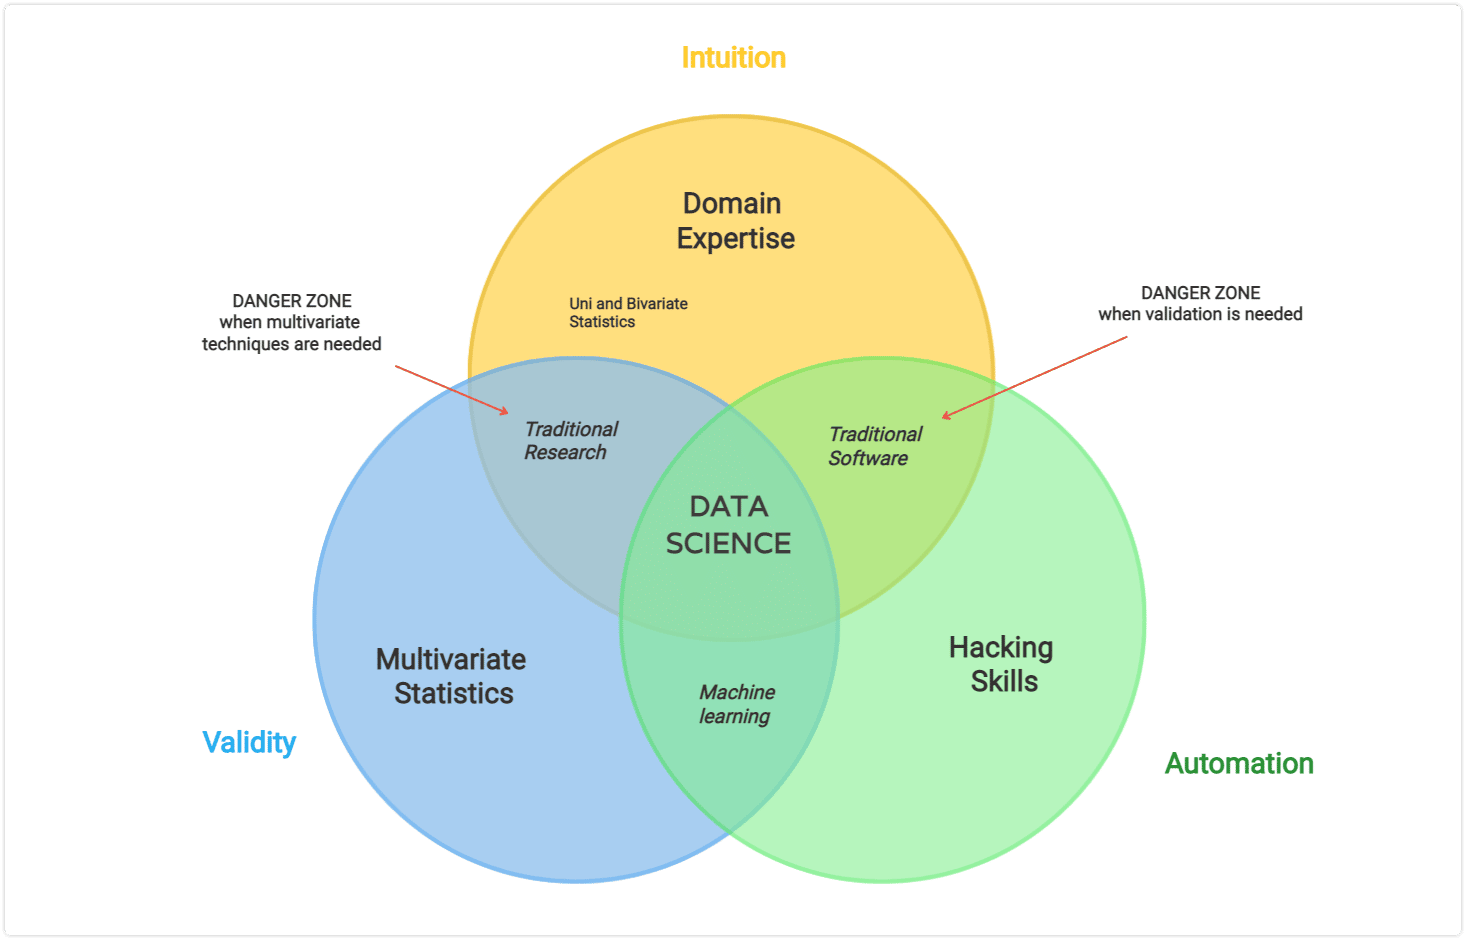
Venn diagrams can also be used in computer science and business. They are particularly useful when it comes to sorting through complex algorithms or working through logical relationships. And those kinds of problems come up all the time within the information systems space.
You can use the diagram to illustrate different concepts or formulas and quickly identify areas of overlap or patterns. This will help you gain a deeper understanding of the data and problem-solve more effectively.
3. Use a Venn Diagram to Compare Political Platforms
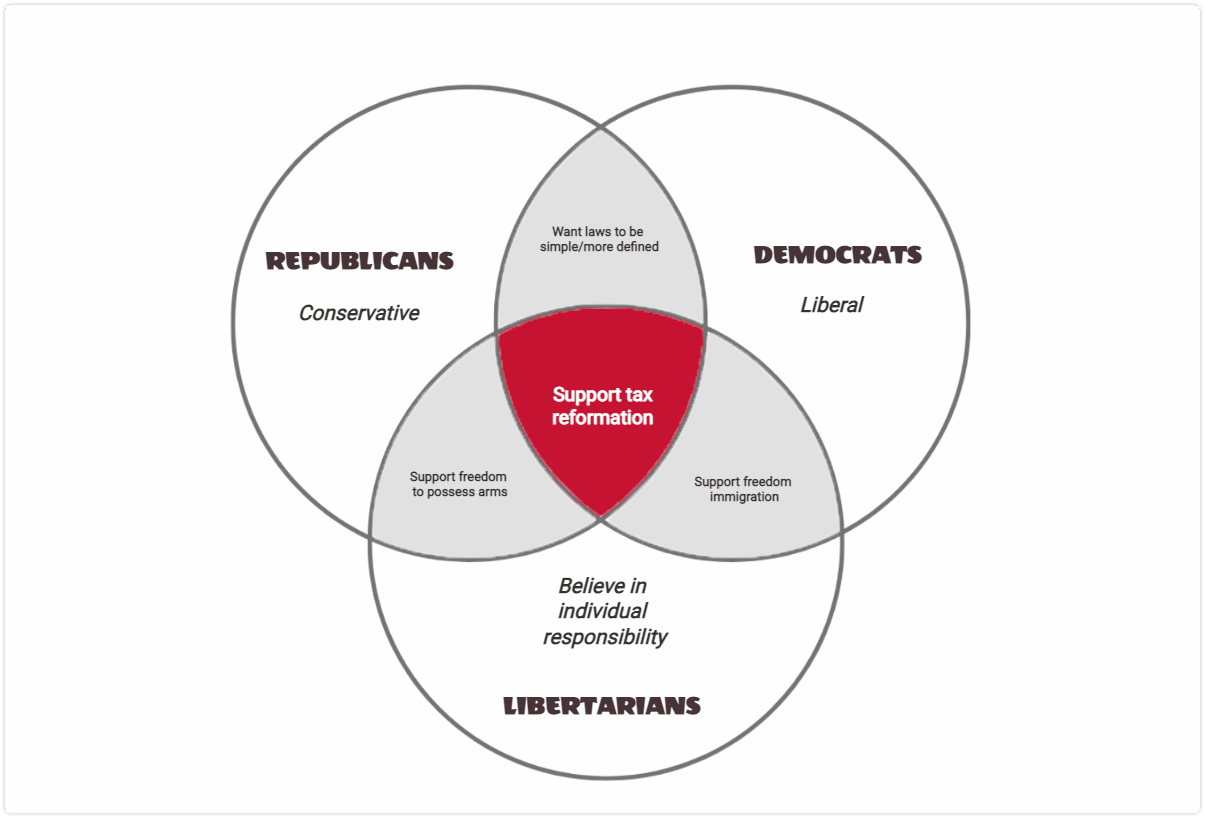
Venn diagrams are incredibly useful when it comes to comparing political platforms.
You can use the diagram to outline the key points of each party’s platform. And you can identify areas of agreement or disagreement between them. This can be incredibly helpful when it comes to making informed decisions on Election Day. Plus, it’s a great way to get people talking about politics in a constructive manner!
4. Use a Venn Diagram to Brainstorm Ideas for Your Next Project
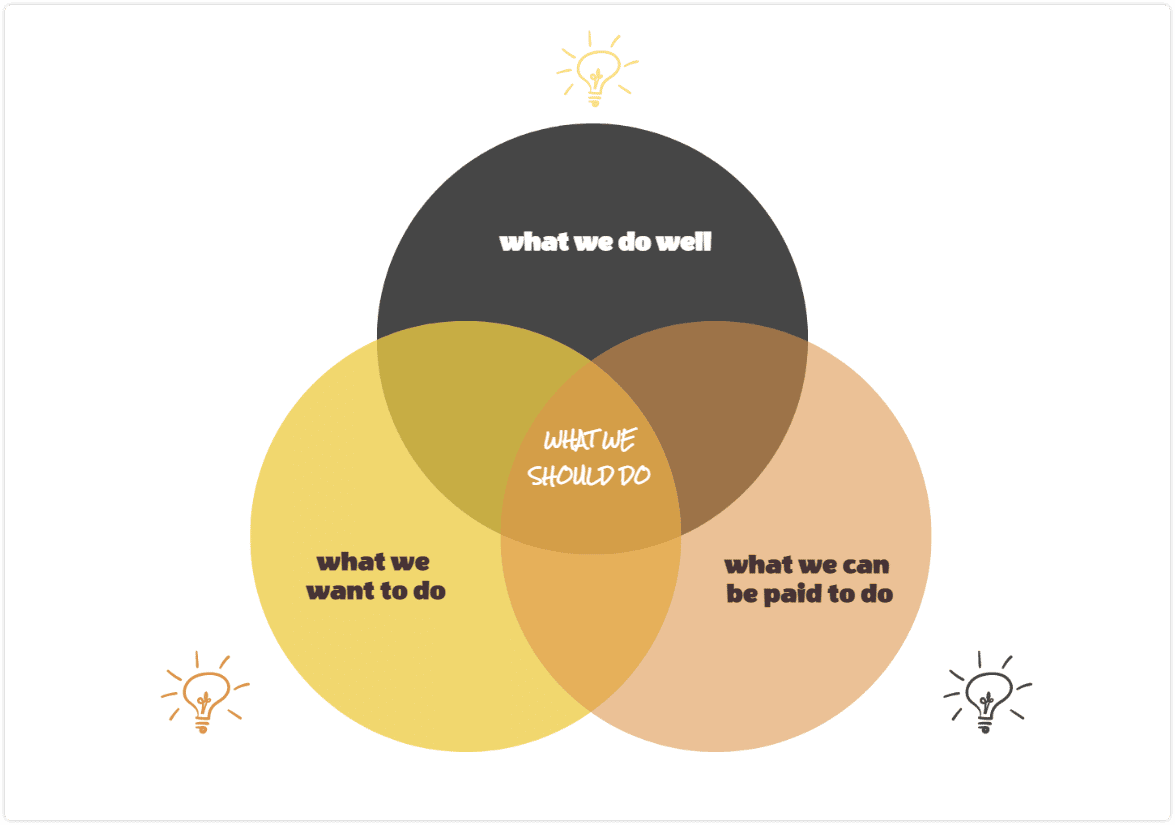
Venn diagrams can help you brainstorm and generate ideas for your next project or product.
When you’re feeling stuck and don’t know where to start, a Venn diagram can help. They’re a useful way of quickly sorting through different ideas and understanding how they relate to each other. This can be especially helpful when working on a collaborative project with multiple stakeholders. After all, they ensure everyone is on the same page.
5. Use a Venn Diagram to Compare Different Philosophies
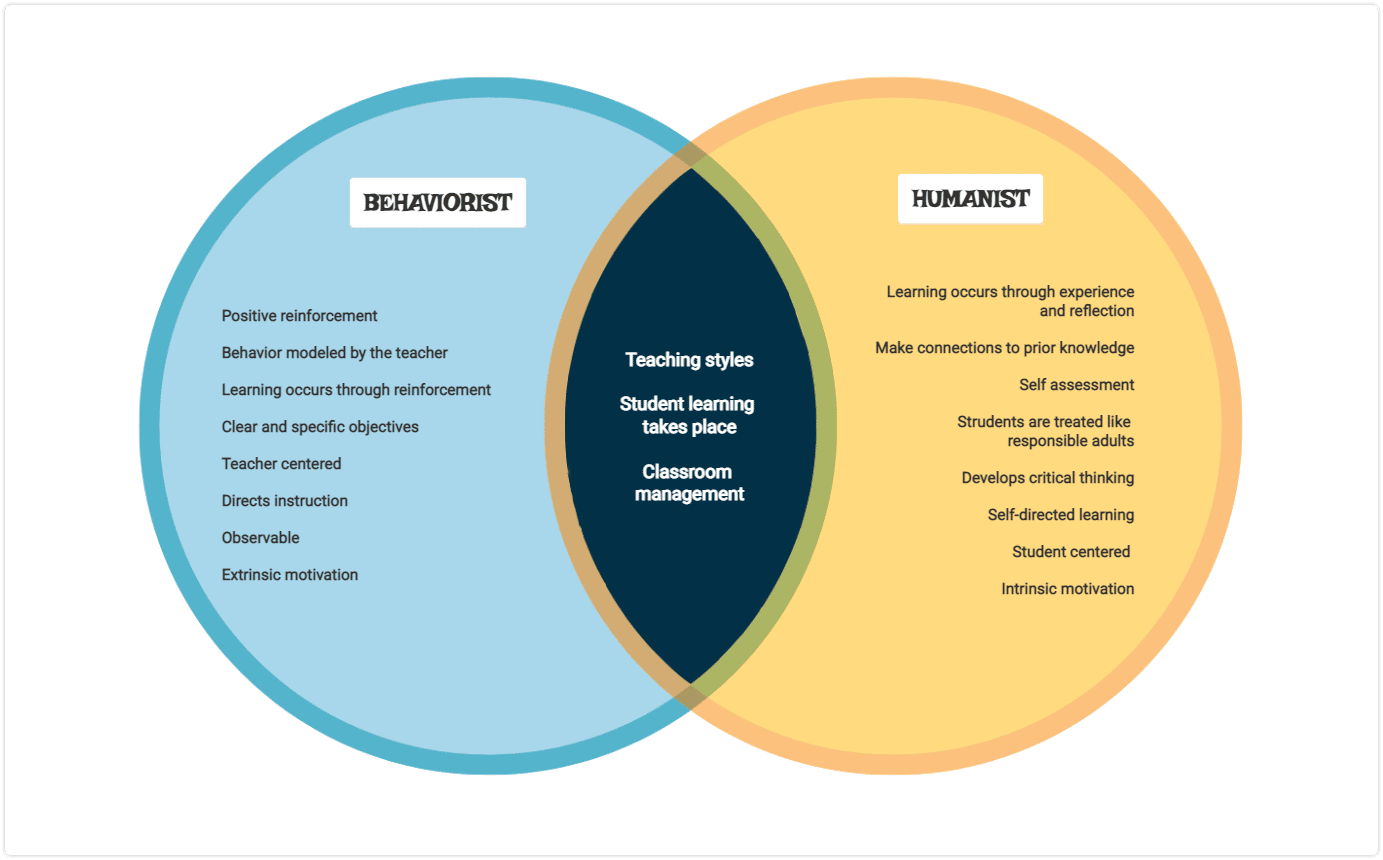
Creating Venn diagrams can show how different philosophies compare and aid in understanding how they relate to each other.
You can compare two different schools of thought. Or map out the differences between various religious views. Venn diagrams are an invaluable tool for sorting through complex topics and gaining insight into different beliefs and practices.
6. Use a Venn Diagram to Analyze Marketing Channels
Venn diagrams can be used to analyze different marketing channels and identify which ones are most effective.
You can use the diagram to break down the various components of a successful marketing campaign. You can create a Venn diagram, noting the effectiveness of website visits, email campaigns, and social media posts. This will help you quickly determine which of these channels yields the best results. So you can focus your efforts for maximum impact.
7. Use a Venn Diagram to Visualize Your Company’s Departments
Creating Venn diagrams can be used to visualize your company’s departments and quickly identify areas of overlap or duplication. This can help you streamline operations and make sure that everyone is working together in an efficient manner.
Plus, it can also be helpful when creating department budgets. After all, it allows you to easily see where money is being spent. Using a Venn diagram can be an invaluable tool for creating an effective organizational structure.
8. Use a Venn Diagram to Focus Your Target Market
Venn diagrams can also be used to focus your target market by identifying areas of overlap between different demographics and interests. This can help you home in on specific customer segments and tailor your marketing campaigns accordingly.
You’ll be able to quickly identify the types of people that are likely to respond best to your message. Then, you can adapt your strategy accordingly. This can be a great way to boost your sales and maximize resources!
9. Use a Venn Diagram to Analyze All Kinds of Data
Venn diagrams are also incredibly useful when it comes to analyzing data sets. You can use the diagram to compare different sets of information and quickly identify areas of overlap or differences between them. This can be a great way to spot trends or correlations and gain better insights into the data. And because it’s so visual, it can also be helpful when presenting these findings.
10. Use a Venn Diagram to Understand Literature
Venn diagrams are also helpful when it comes to understanding literature or other pieces of written text. The right Venn diagram shows the various themes, characters, and storylines of a work of literature. This will give you a better understanding of the work as a whole.
That’s why it’s a great tool for literary analysis. It’s particularly powerful when trying to spot links between multiple works or draw connections between different pieces of writing.
A few closing thoughts
Venn diagrams are a powerful tool for making sense of complex topics, teaching set theory, and visualizing ideas. They can help you if you’re a teacher, a writer, or a scientist. They allow you to quickly break down information into digestible chunks so that it can be better understood. And they provide a visual mechanical representation of propositions.
So, whether you’re trying to analyze marketing channels or understand literature, why not draw a Venn diagram?
While you can use a pen and paper, diagram software like Mindomo is even better. It will give you the ability to edit your diagrams in myriads of ways. You can change colors, add backgrounds, attach files, and more. Then, you can use this diagramming tool to share your Venn diagram with others and even collaborate.
Keep it smart, simple, and creative!
The Mindomo Team