Do you remember your high school English teacher telling everyone to draw two overlapping circles on a piece of paper? Over one circle, she said to write something like ‘Romeo and Juliet.’ Over the other she said to write ‘West Side Story.’ Then, she told everyone to write the differences between them on the outside and their commonalities on the inside.
That was a Venn diagram! They’ve been around since John Venn, an English logician, invented them as a tool for set theory in the 1800s. And they are still used today in everything from marketing to math. They can even help you find your purpose in life.
In this article, we’ll explore everything you need to know about Venn diagrams. You’ll discover their history and how they can be used in a host of different ways.
What is a Venn diagram and how is it used?
A Venn diagram is a great way to visually organize information, and it offers a diagrammatic and mechanical representation. It’s an easy and fun tool to use to discover how two or more things compare and contrast.
Venn diagrams feature overlapping circles that represent sets that share some similarities but also have their own particular characteristics. The area in the middle where they intersect shows elements they share in common. The other parts of each circle represent distinct features of each set. It’s a mechanical representation of propositions.
You can use Venn diagrams to describe relationships between concepts, symbols, or any other kind of data sets. They’re most often used in fields like mathematics, science, computer science, engineering, and market research. They visually illustrate groups or categories of objects or data points for easier comparison and analysis. The set represents anything you want it to.
Is a Venn diagram always 2 circles?
While most people picture two overlapping circles when they think of Venn diagrams, that isn’t the only kind out there. In fact, they can have as few or as many circles as needed.
You might find that a 2-circle Venn diagram is the most versatile and easiest to create. But if you need to compare and contrast more than two elements, you can use as many as five circles.
No matter how many circles are in your diagram, the same principles apply. Each circle represents a set of items, and the overlapping parts represent similarities between those sets.
The History of the Venn (and Euler) Diagram
John Venn was born in London, England, in 1834. He attended Cambridge University and went on to become a professor of mathematics at the same university. He was interested in logic and set theory. So, he developed the diagrams that bear his name as a way of better visualizing logical relationships between different sets. Each set represents some object or class of data. These diagrams became known as Venn diagrams when Clarence Irving coined the term. His book A Survey of Symbolic Logic made a splash, and the term ‘Venn diagrams’ was soon adapted by others.
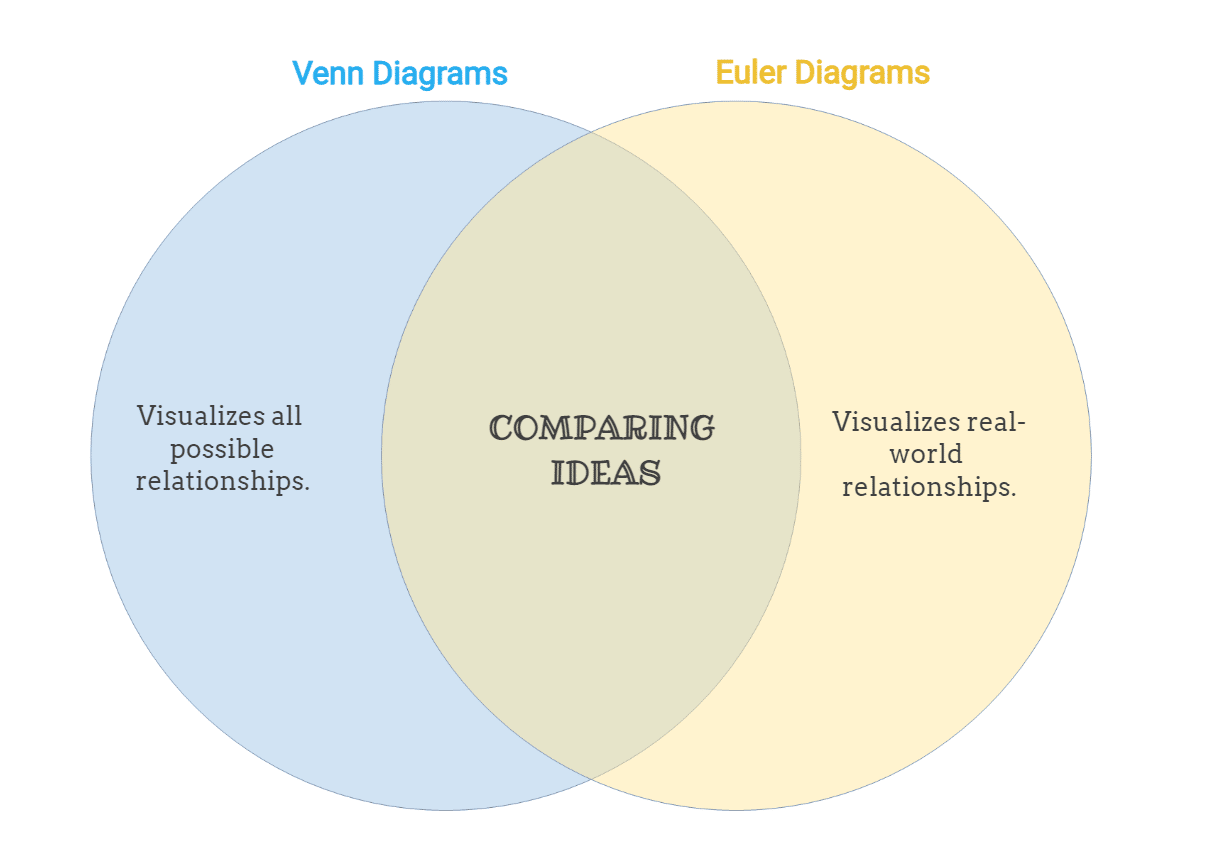
Although Venn diagrams have always been the more popular logic diagrams using circles, they aren’t the only type. Euler diagrams, similar diagrams, were first introduced by the Swiss mathematician Leonhard Euler in 1768. The concept of these diagrams was based on circles and set theory as a form of logical representation. Unlike Venn diagrams, Euler diagrams visualize actual relationships between objects, while Venn Diagrams illustrate all possible relationships. This is yet another way to create a mechanical representation of propositions.
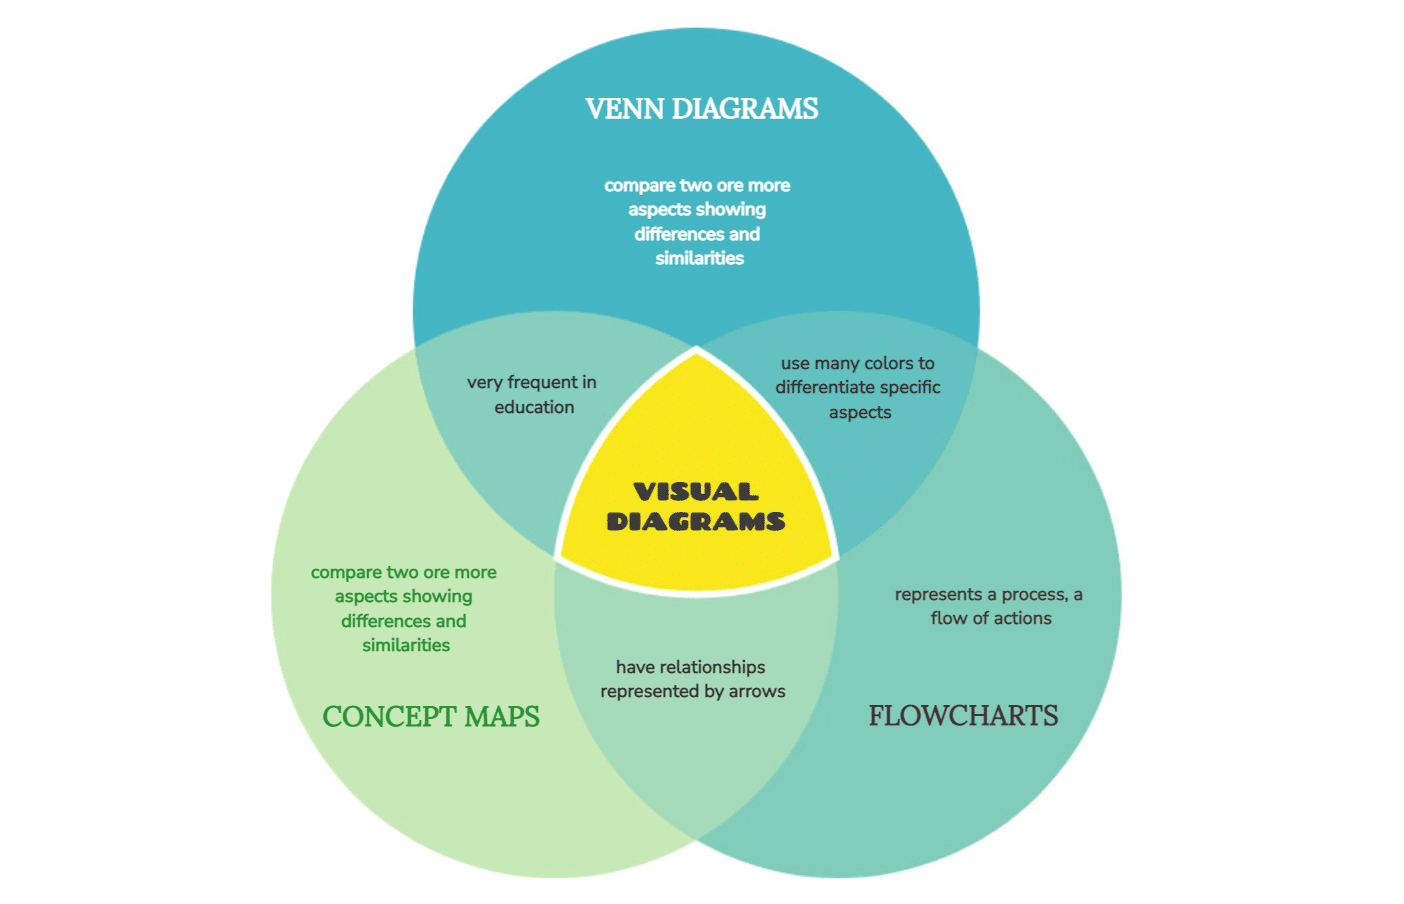
These two kinds of graphic organizers can be used in different ways to visualize all kinds of data sets.
How do you make a graphic organizer? (with examples)
Making a Venn diagram is a great way to display data in an organized and visually appealing fashion.
To get started, you’ll need two overlapping circles which represent the two sets of data you are comparing and contrasting. Once that is set, simply begin filling in the blank space within the diagram. You’ll want to include labels or statements that show how the two sets are similar and different from each other.
It’s important to remember to use color coding if possible. This makes it easy for viewers to understand the data sets of your Venn diagram. The last step is making sure everything is aligned properly. All the overlapping elements should line up perfectly in order for it to be an effective visual aid.
While you can draw Venn diagrams using nothing more than pen and paper, it’s not particularly effective. With mind map software like Mindomo, you can create and edit Venn diagrams quickly and easily. Plus, you can attach links, images, videos, and other files to them so that they’re much more robust and useful. And you can share them with others when you’re finished.
5 Uses of Venn Diagrams
Venn diagrams are one of the most useful tools out there when it comes to visualizing data.
Venn diagrams have been a go-to resource for decades. They’ve been used for analyzing community relationships and comparing attributes between products or services. And they’ve been used to explain complicated concepts and more.
It’s no surprise that this type of diagram has become so popular. After all, their circles demarcating distinct sections and the ability to group information in an easy-to-understand format makes them invaluable. There are dozens of reasons someone might create a Venn diagram. But here are five of the most popular Venn diagram example uses.
1. Venn diagrams & marketing
Venn diagrams and Euler diagrams can be used to develop marketing strategies. Venn diagrams can be used to compare different products or services. While Euler diagrams can be used to identify potential customer segments. Both are useful for identifying ways to market a product and how to tailor the message for the audience.
2. Venn diagrams & business
Venn diagrams can also be used in business to map out customer journeys and analyze customer data. They break down each step of a customer journey into distinct sets. That way, marketers can more accurately identify where potential customers may drop off during their journey. This helps businesses address any issues that lead to churn and optimize their marketing efforts.
3. Venn diagrams & education
Education mind maps of every kind are valuable for teaching and learning new information. Venn diagrams and Eulerian circles can also help educators explain complex topics in a visual format that’s easier for students to understand. By breaking down the components into distinct sections, it’s much easier for the students to comprehend and remember the material.
4. Venn diagrams & linguistics
For linguists, Venn diagrams show analyses of language structures and compare words and phrases. Venn diagrams can also be used in biology to compare species or to compare different types of cells. They’re a great way to create a diagrammatic and mechanical representation of complex scientific concepts.
5. Venn diagrams & writing
Logic diagrams like Venn diagrams and Euler diagrams can be used to graphically organize writing projects as well. By breaking down the writing process into distinct sections, writers can organize their thoughts and approach their projects efficiently. Plus, diagrams like these make it easier to identify any weak points or areas that need more research.
Highly versatile and extremely informative, these diagrams are a powerful tool for teachers, learners, business people, and more.
A few closing thoughts
Venn diagrams are a great tool for helping to organize information and ideas visually. By utilizing circles that overlap, we can illustrate connections and distinctions between topics.
Whether you’re a student, a professional, or just organizing tasks, getting creative with Venn diagrams can unlock endless possibilities. For instance, the student may use an education mind map to compare and contrast characters in a book. The professional may find Venn diagrams helpful to chart similarities in customer data. And those in computer science may use a Venn diagram example to analyze potential solutions to a problem.
Even if you’re just trying to manage your day-to-day tasks, understanding when competing priorities overlap can be invaluable. With these versatile graphic tools at our disposal, the possibilities are truly limitless!
Venn diagrams are a helpful tool for any visual thinker (read more about what is visual learning). By learning how to create and use them effectively, you can take your thinking to the next level. With these tips in mind, give Venn diagrams a try in your personal and professional life – you may be surprised at how useful they can be!
And with Mindomo, you’ll have a tool that makes creating them a snap.
Keep it smart, simple, and creative!
The Mindomo Team