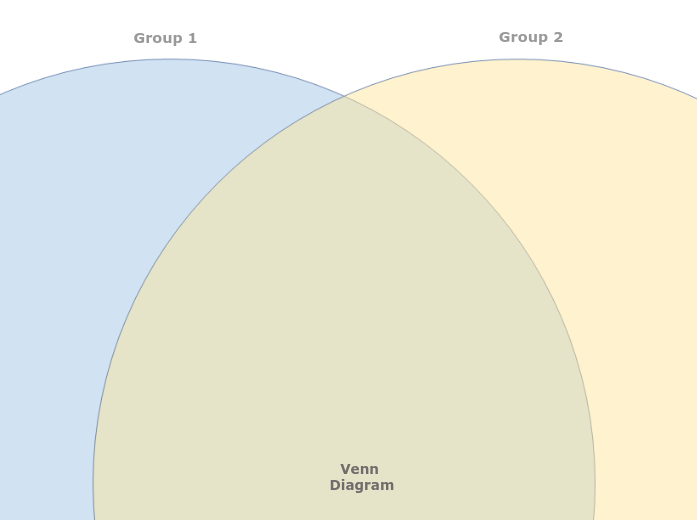
A Venn Diagram helps to understand the similarities and differences between items, by showing their membership of two groups. Visualize complex relationships and comparisons with the simple Venn Diagram template. This template allows you to map out two or more overlapping sets to identify similarities, differences, and intersections. Start by filling in each circle or section with your data or categories. The overlapping areas will reveal commonalities and unique aspects of each set. Ideal for data analysis, brainstorming sessions, and strategic planning, this diagram helps you clearly understand how different sets interact and relate to each other, providing valuable insights for decision-making and problem-solving. Type in the name of the second group and press Enter. Type in the name of the first group and press Enter. A Venn Diagram compares items by assigning them to groups. An item can belong to: The item counts (and not the areas of the circles and their overlap) indicate the population of each group or the overlap between groups. Every Mindomo template opens with its structure already in place: descriptive topics, guiding notes attached to the branches where people usually get stuck, and a default shape that new topics inherit. Edit it in the browser, switch it to a concept map, outline or Gantt chart without redrawing anything, and export it in more than twenty formats. See how mind map templates work, or browse the full gallery by category.Blank Venn Diagram
About this template
Venn Diagram template
Group 2
Double-click in the background to add items to this group, or drag to position them in the overlap between the two groups.Group 1
Double-click in the background to add items to this group, or drag to position them in the overlap between the two groups.Venn Diagram
Why use a Mindomo mind map template?
-
Products
-
Uses
- General Uses
- Mind Maps for Education
- Mind Maps for Business
- Mind Maps for Personal Development
- Assistive Technology
- Team Collaboration
- Campaign briefs for marketers
- Client discovery workshops for consultants
- Onboarding journeys for HR & L&D
- Knowledge Management
- Team Skills Matrix
- Engagement Library
- Roles
- Marketers
- HR & L&D
- Consultants
- Project Management
- Marketing campaign planning
- Employee training rollouts
- Scope of Work
- Idea Organization
- Issue Trees
- Training Needs Analysis
- Mind Mapping Benefits
-
Solutions
- Guides
- Make Presentations with Mind Maps
- How to Learn with Mind Maps
- Plan and Organize with Mind Maps
- Prioritize Tasks with Mind Maps
- Take Notes with Mind Maps
- Real Customer Stories
- Scaling educational content for 11,000 doctors
- Team workflow: from trial to indispensable in two months
- 10 years without slides: rethinking architecture lectures
- Read all stories
-
Resources
- Learn the basics
- What is a Mind Map?
- How to Mind Map?
- What is a Concept Map?
- Benefits of Mind Mapping
- Guides & Support
- Video tutorials
- Help center
- Forum
- Examples & templates
- Top 29 Mind Map Examples
- Concept Map Templates
- How to Make a Gantt Chart
- Mindomo's Efficiency in Education
- Feature pages
- Education
- Teacher Assignments
- Work & Personal
- Desktop
- The Mindomo blog
- Pricing
- Log In
- Sign Up
- Dashboard
Mind Mapping Benefits
Why visual thinking makes recall and planning easier.
Learn the basics
Guides & Support
Examples & templates
Feature pages
 Blog
The Mindomo blog
Guides, examples and research on visual thinking.
Browse all articles
Blog
The Mindomo blog
Guides, examples and research on visual thinking.
Browse all articles