Visual diagrams are powerful. They can take complex ideas, data, and processes and distill them down into something understandable. They’re versatile. They’re easy to use. And they can help everyone from high school students to high level corporate executives.
Whether you’re looking to improve your understanding or communication of information, visual diagrams can help.
In this article, we’ll explore everything you need to know about visual diagrams. You’ll learn what they are, their benefits, their uses, and how to create them. We’ll even talk about how you can export and download them as a PDF or other file.
What is a visual diagram?
Visual diagrams are graphical representations of data, processes, and ideas. When designed well, they help us understand complex information more easily. They also enable us to organize, analyze, and communicate information more effectively.
Most visual diagrams take advantage of several key elements, including colors, lines, arrows, shapes, icons, and more. More advanced, digital diagrams may even include videos or a link to another site.
Visual diagrams can help you visualize information, identify patterns, and make connections. But there’s not just one kind. There are many different types of visual diagrams, each with its own unique benefits and applications.
Here are a few of the most common.
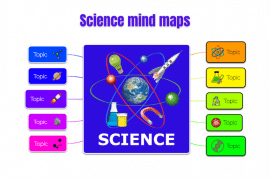
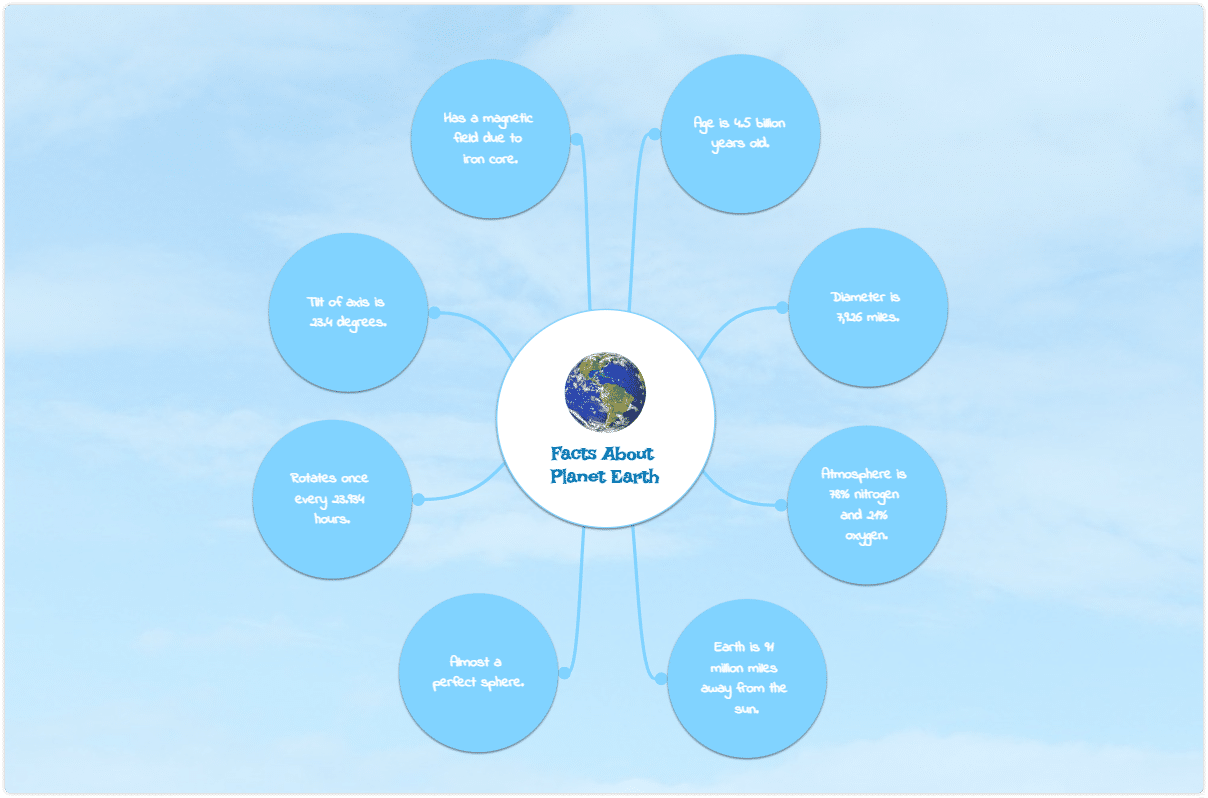
1. Mind Maps
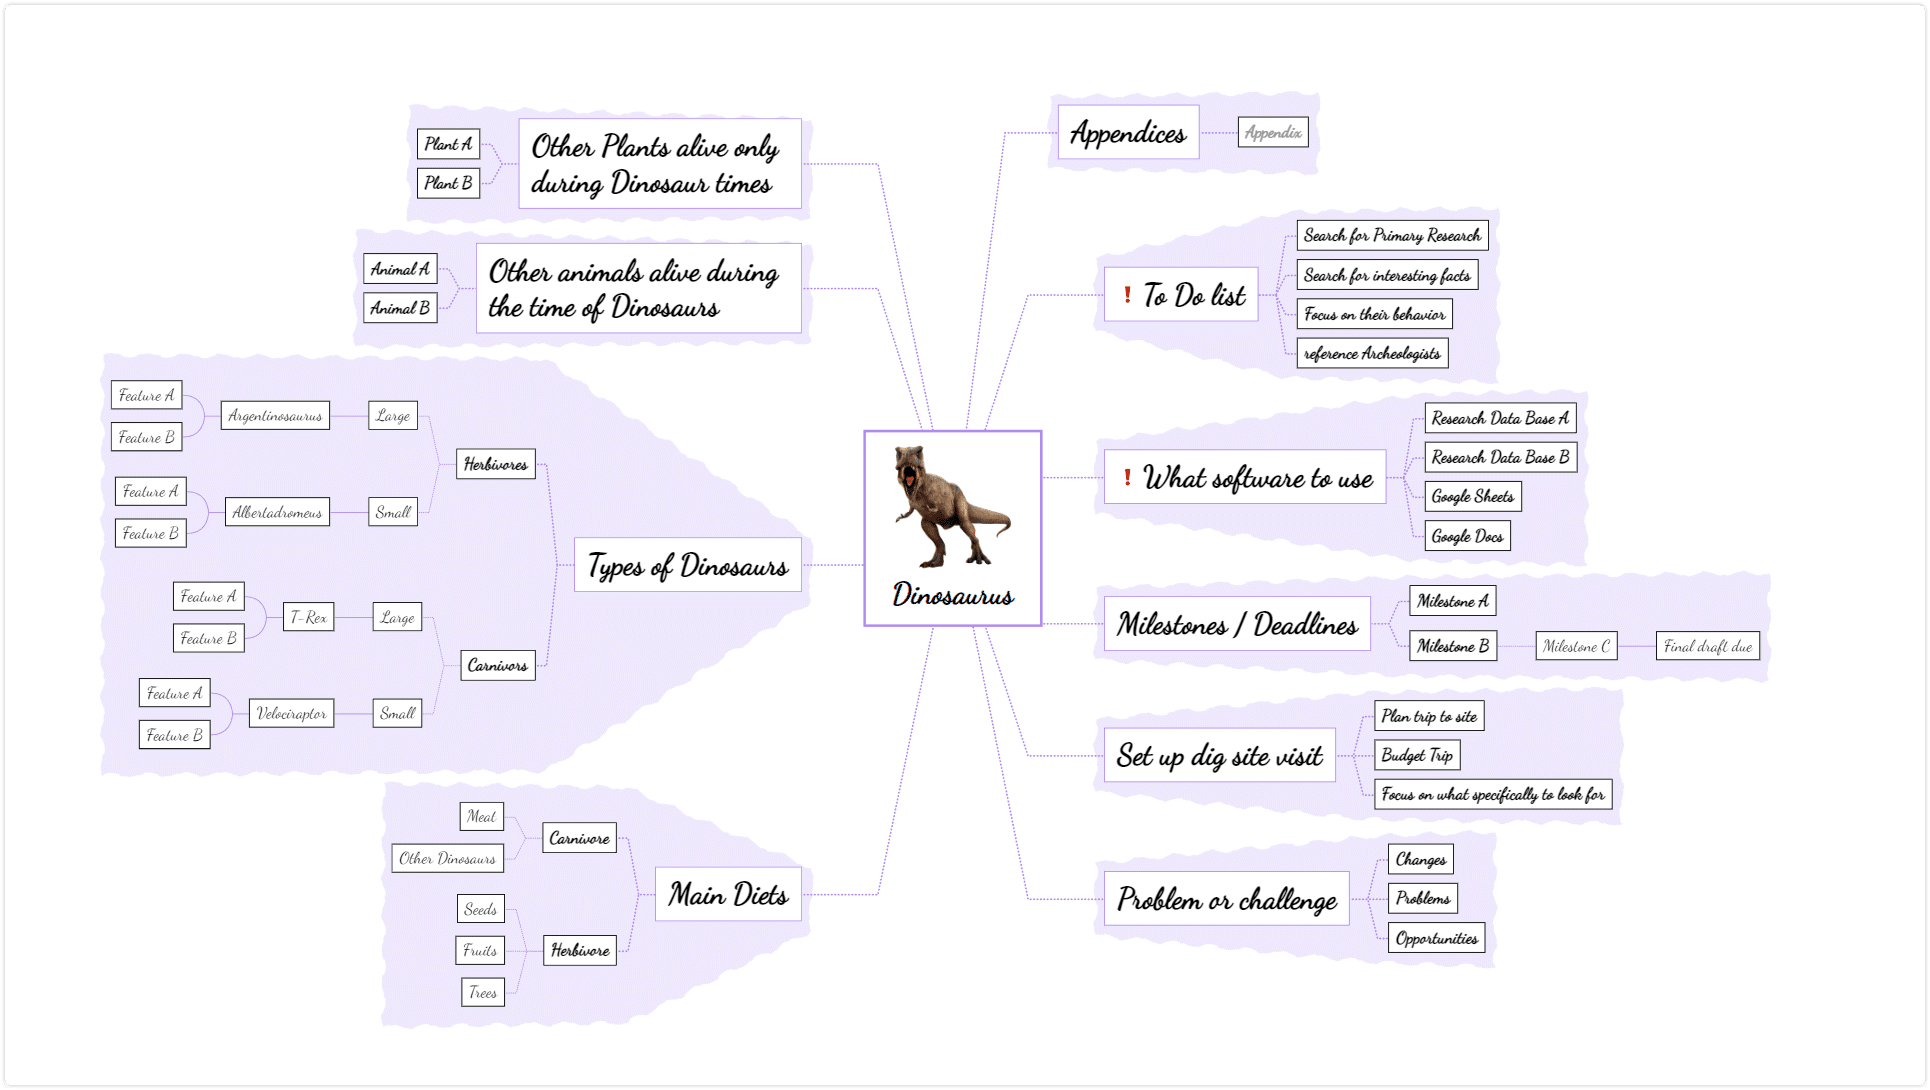
Mind maps are great for brainstorming and organizing ideas. They allow users to capture and connect ideas and see how they relate to each other. Concept maps are similar to mind maps but are more structured and hierarchical (see a detailed concept map vs mind map comparison here). This makes them useful for organizing complex information.
2. Flowcharts
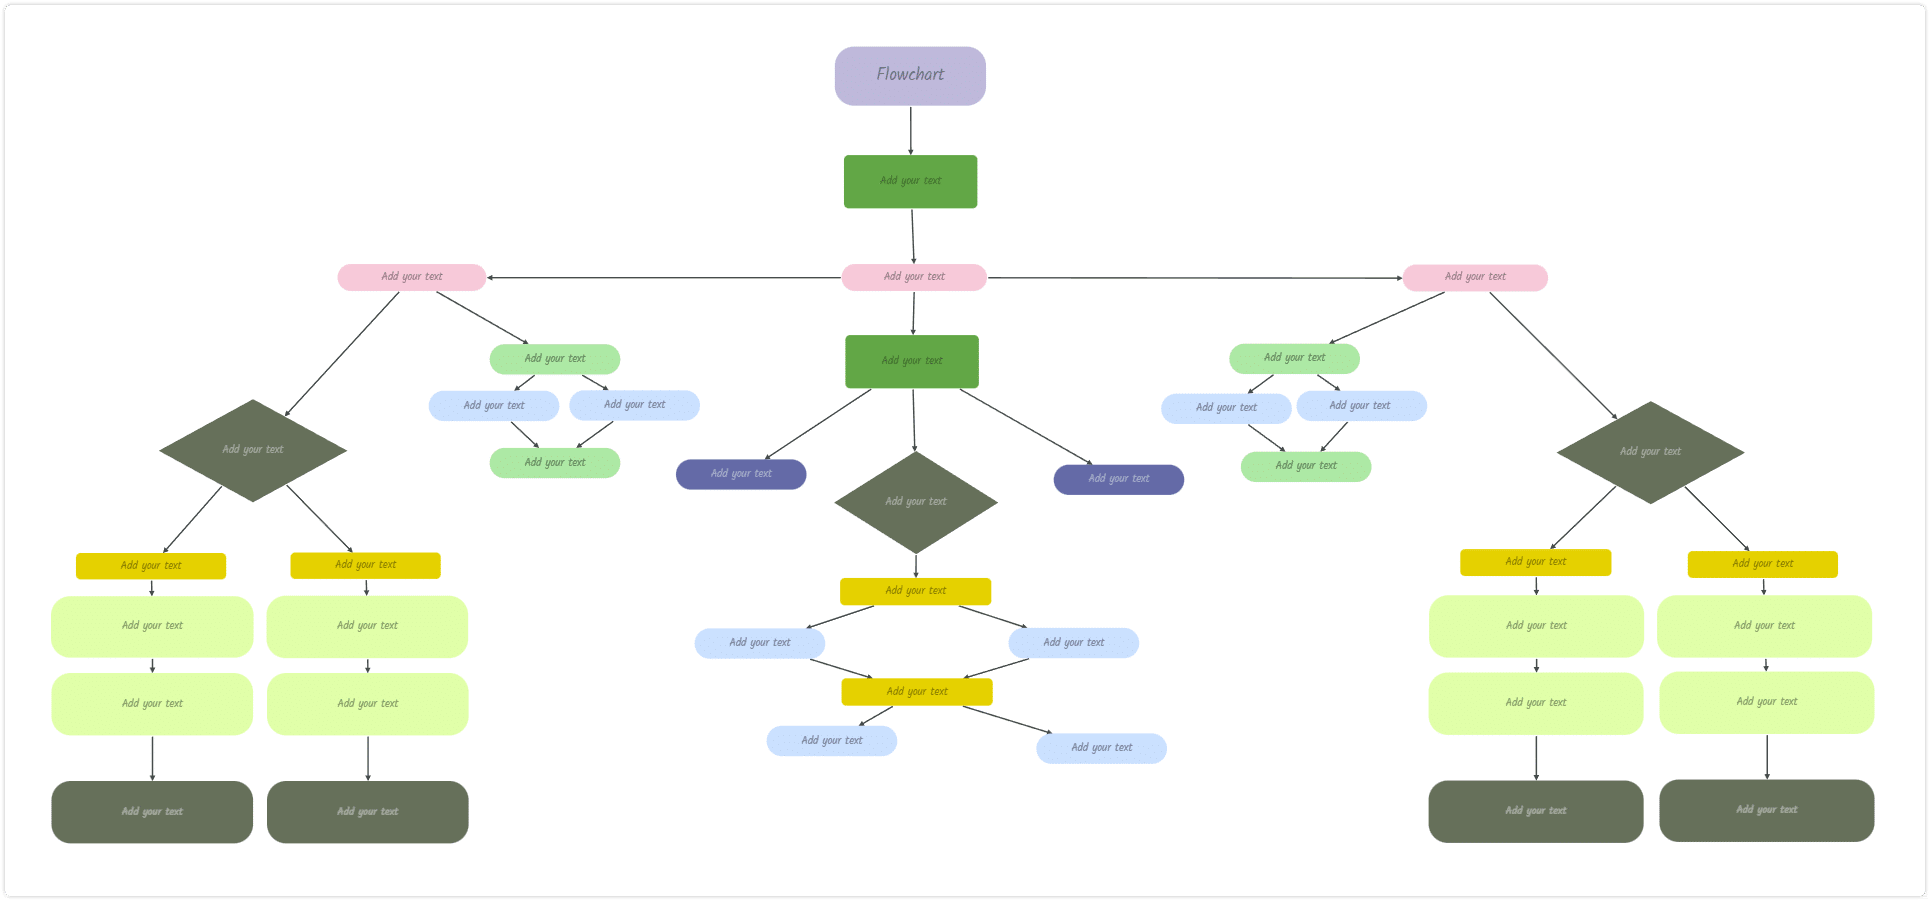
Flowchart diagrams are ideal for mapping out complex processes. They allow users to visualize the steps involved in a process. They help with identifying bottlenecks and areas for improvement. And they can work wonders for streamlining workflows.
3. Line, Pie & Bar Graphs

Line graphs and bar graphs are useful for presenting numerical data. Line graphs are great for showing trends over time. Meanwhile, bar graphs are useful for comparing different categories or groups of data. Pie charts are excellent for comparing percentages and showing the composition of a whole.
4. Fishbone Diagrams
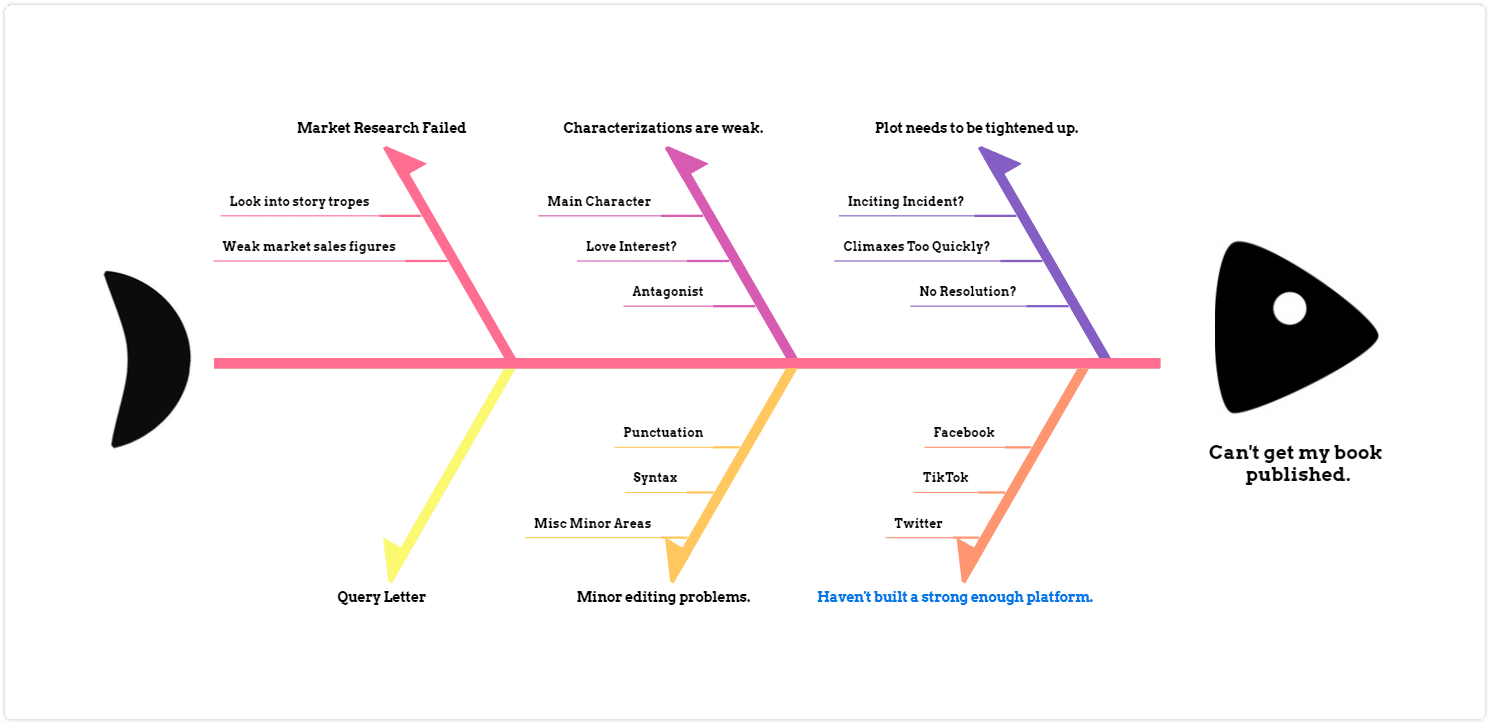
Fishbone diagrams, also known as cause-and-effect diagrams, are helpful for identifying the root cause of a problem. They allow users to identify and visualize the factors that contribute to a problem and see how they are interconnected.
5. Venn Diagrams
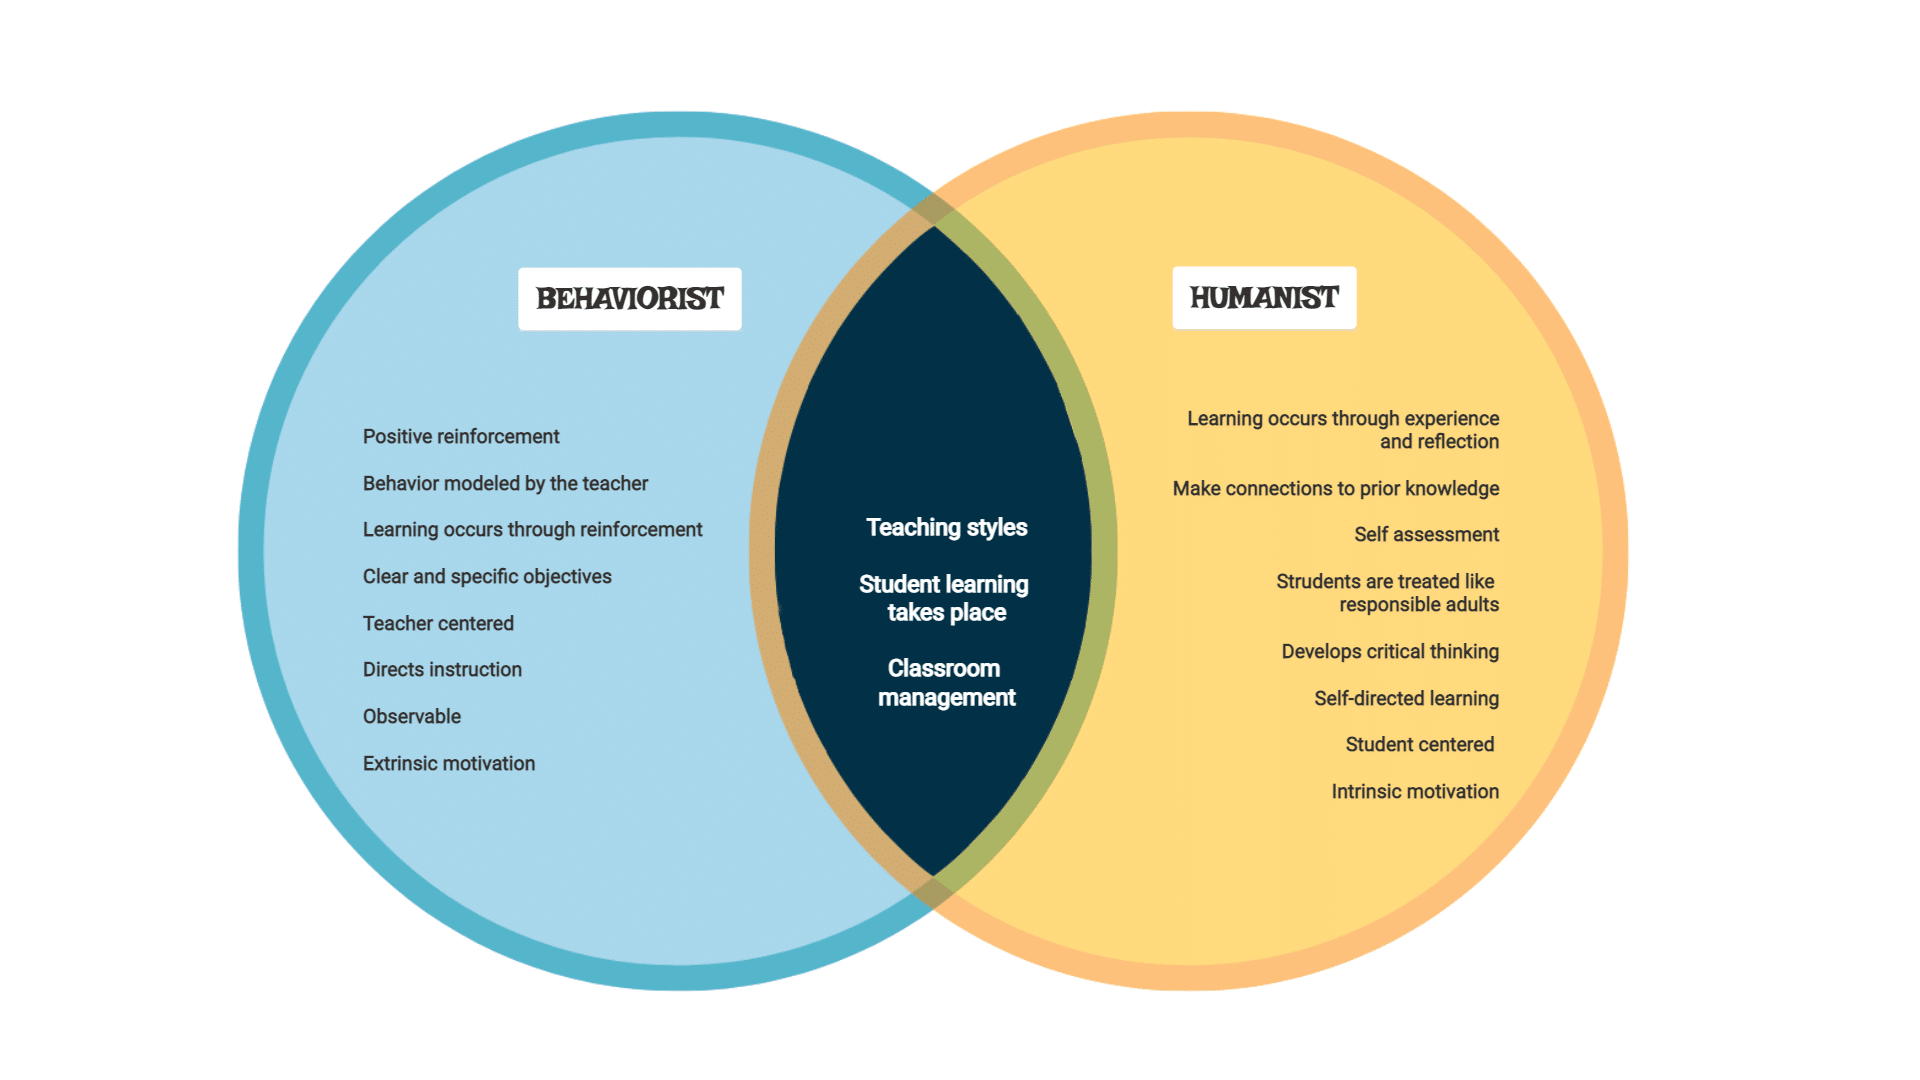
Venn diagrams can be used to compare and contrast different sets of data. They are made up of overlapping circles, with each circle representing a set of data. The areas where the circles overlap represent the commonalities between the sets. The non-overlapping sections reveal the differences.
6. Beyond the Venn & Fishbone Diagram
There are a host of specialized diagram types beyond these most basic kinds.
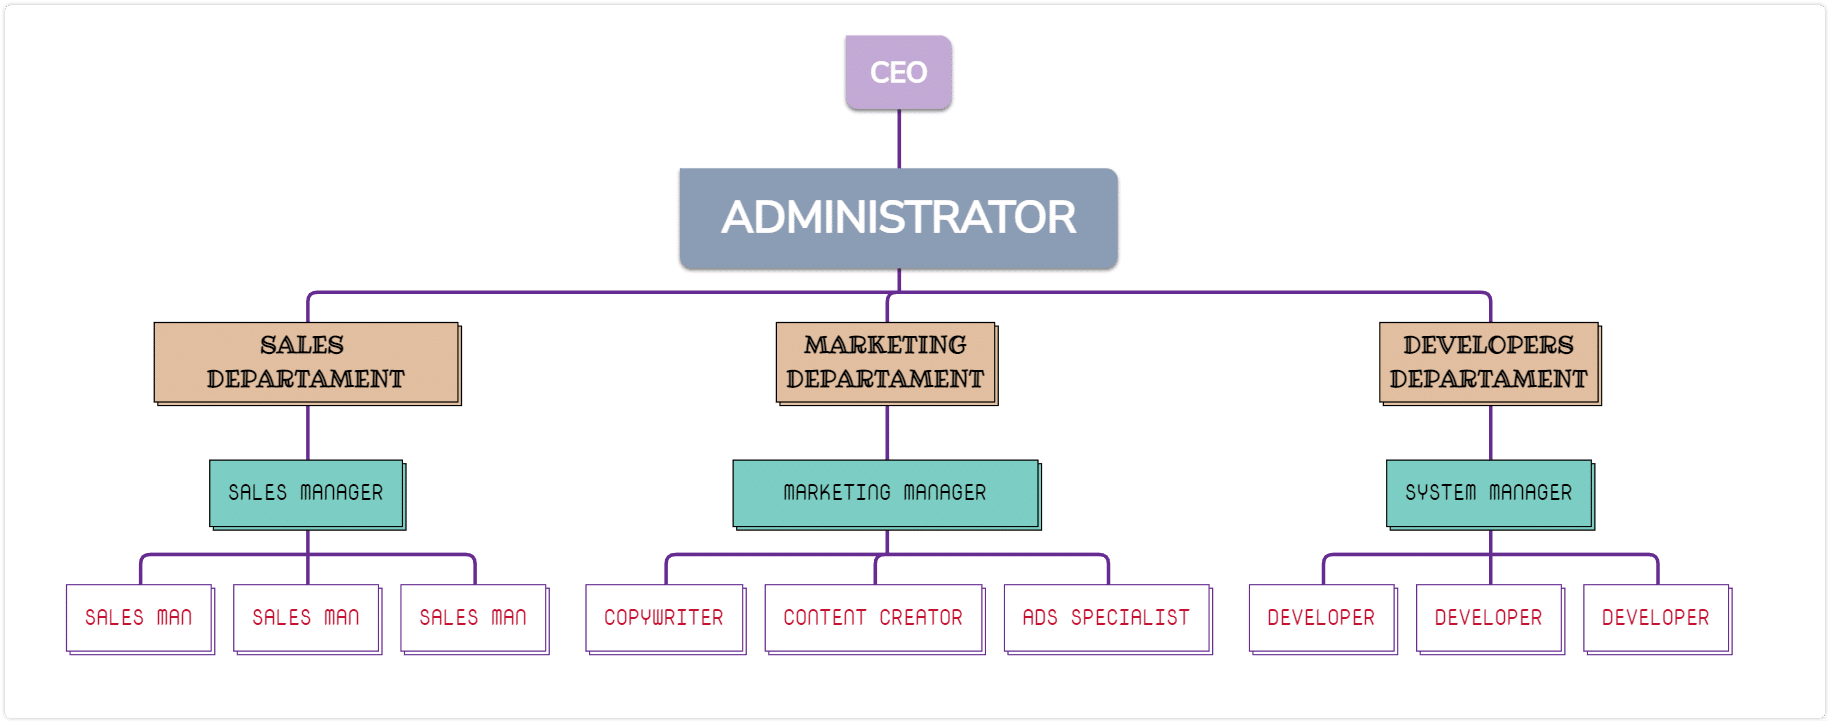
For example, tree diagrams are useful for representing hierarchical structures, such as family trees (family genograms) or organizational charts (organigrams).
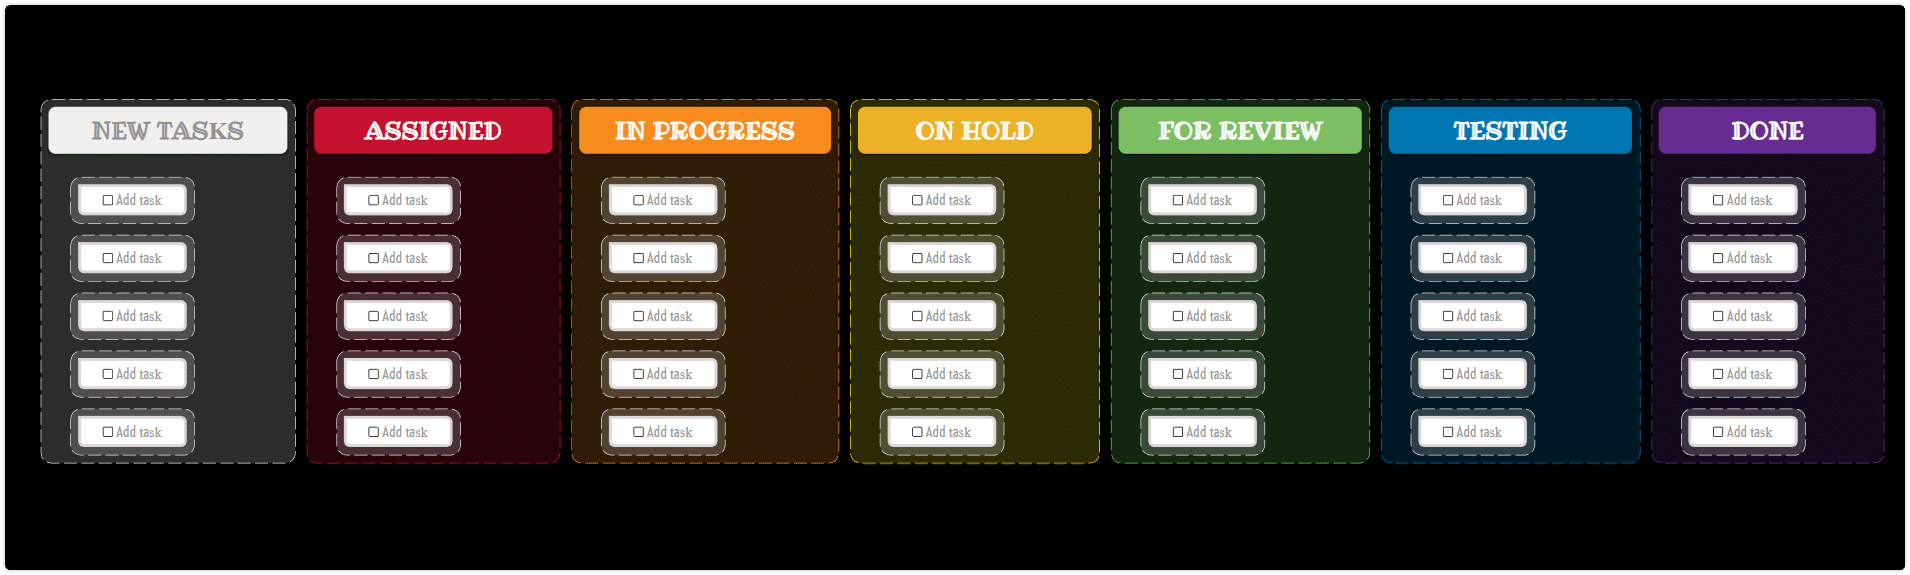
Kanban boards are visual tools used for managing and organizing tasks in a project or workflow.
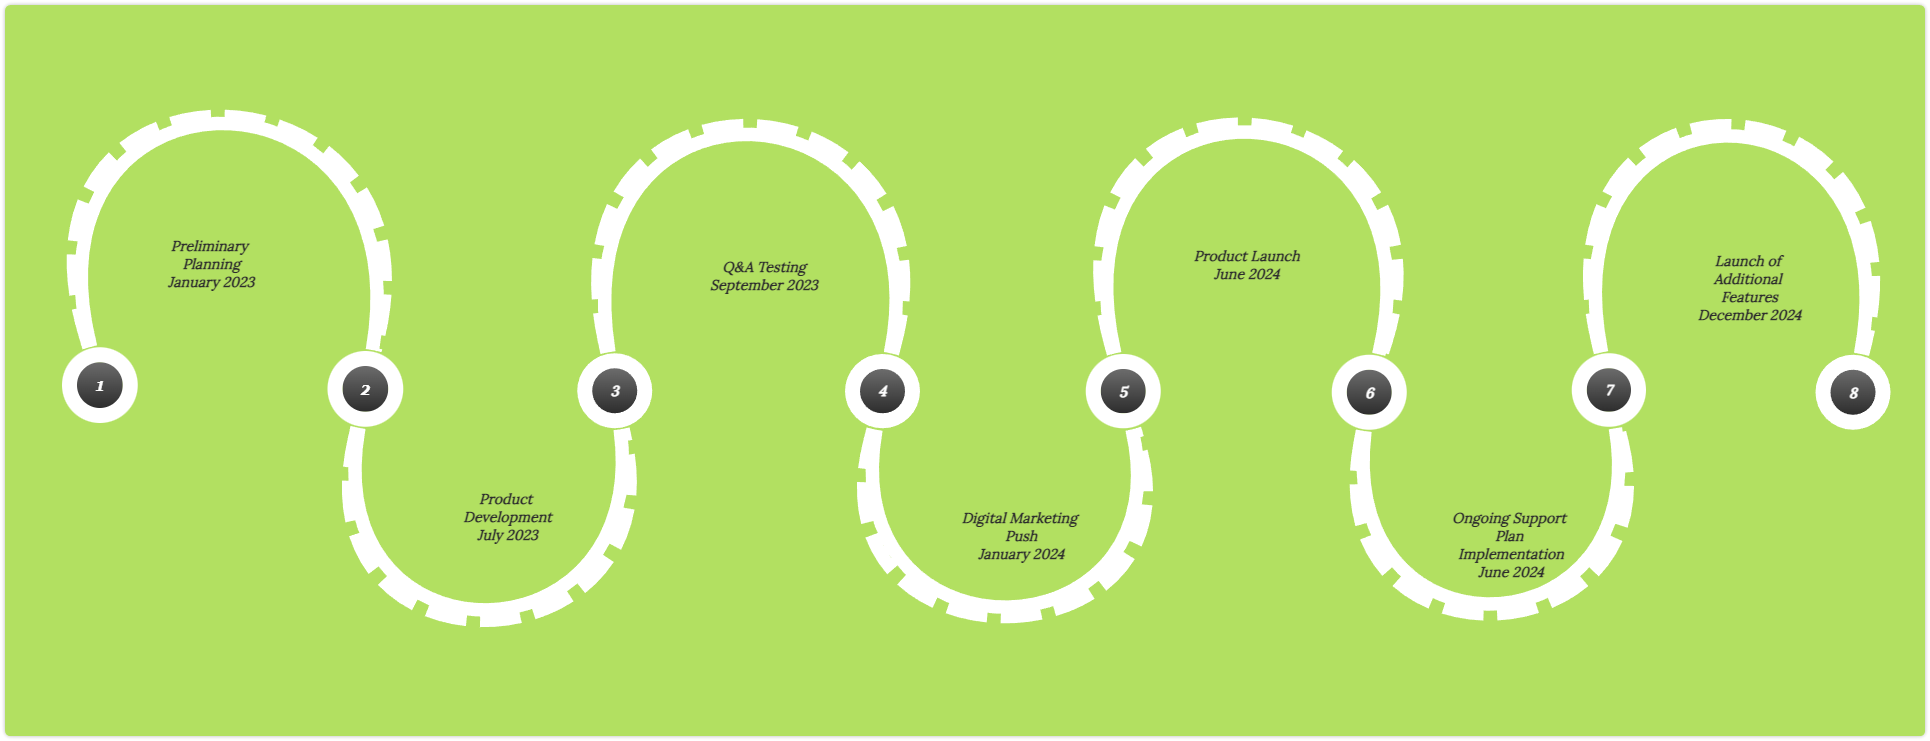
Roadmaps are used to plan out the various stages of a project.
Bubble maps are used for brainstorming and categorizing ideas.
There is a diagram type that can help users visualize and make sense of virtually any kind of information. By choosing the right diagram type and customizing it to fit their needs, users can achieve nearly any goal. They can enhance their understanding of complex data. Or streamline their workflows. Or communicate their ideas more effectively. Or do a dozen other things.
The benefits of using visual diagrams and diagram templates
Visual diagrams offer a range of benefits that make them indispensable tools for many industries and professions. Some of the key benefits include:
1. Improved comprehension and memory retention
Visual diagrams help to organize complex information into an easily digestible format, making it easier to understand and remember. Studies have shown that information presented visually is more easily remembered than information presented in text form. This is particularly helpful when dealing with large amounts of data or complex processes.
2. Better organization and planning
Visual diagrams allow you to organize your thoughts. They also help you plan ideas and processes in a more structured way.
Diagram templates can help you to create diagrams quickly and easily, ensuring that you are on the right track from the start. Create a fishbone diagram to identify the root cause of a problem. Or design a flowchart to map out a process. Visual diagrams can help you see the big picture and identify areas that need improvement.
3. Increased creativity and idea generation
Visual diagrams can help to spark creativity and generate new ideas. By using different types, you can brainstorm and connect ideas in new ways. The ability to visualize ideas and concepts in a non-linear format can also help uncover new patterns. And it can reveal connections that may not be apparent in a traditional text-based document.
4. Enhanced communication and collaboration
Visual diagrams are an excellent tool for communication and collaboration. They can ensure that everyone is on the same page and has a clear understanding of the project at hand.
With intelligent diagramming tools, such as those provided by Mindomo, you can easily share diagrams and collaborate in real time. This can help to streamline the decision-making process and ensure that everyone is working towards the same goal.
What is a visual diagram used for?
Visual diagrams are not just for artists or designers. They can help anyone, from students to business people, to process complex ideas and information. Visual diagrams provide a way to simplify ideas, communicate more effectively, and retain information better. Whether you’re planning a project, explaining a concept, or analyzing data, diagrams can help you make sense of it all.
Examples of these benefits in various use cases
The benefits of visual diagrams are evident in a range of use cases, from education to business to science. In education, visual diagrams can help students to better understand complex concepts and retain information. In business, they can be used to map out processes, analyze data, and communicate with stakeholders. In science, they can help to visualize complex systems and structures, making it easier to analyze and understand data.
One of the advantages of using visual diagrams is that they are often more engaging and memorable than traditional text-based documents. Our brains are wired to process visual information quickly and efficiently, so by using diagrams, you can tap into that natural cognitive process.
How do you create a visual diagram?
There are many tools available for creating visual diagrams, including Mindomo, a popular graphic organizer app.
Mindomo is a powerful visual diagram software that allows you to create diagrams easily and intuitively. With Mindomo, you can create all kinds of diagrams with just a few clicks.
Another advantage of using mind map builder like Mindomo is that it offers a template library. This way, you can get your visual designed quickly and easily.
Imagine you’re trying to create a fishbone diagram to analyze a problem. Mindomo has templates and components that can help you create that diagram efficiently. Or think about the steps you’d need to take to create a flowchart. Mindomo has the right shapes and components to help you do that – without any hassle.
Mindomo doesn’t just make it easy to create visuals. You can also customize them in dozens of ways. Add icons. Change colors and designs. When you’re finished, you can share it with your team via a safe, secure link. Or you can export and download it as a PDF or other file.
In conclusion, visual diagrams are a powerful tool that can help anyone. Students, business people, content creators, scientists, and more can make better sense of complex ideas and information. And Mindomo makes it easier than ever to do.
Now you’re ready. Create diagrams with Mindomo!
The advantages over traditional text-based documents are clear: visual diagrams help with information retention. They make complex systems and processes easier to understand. They also facilitate better communication and collaboration among teams.
Mindomo offers a wide variety of diagram templates that can be customized to fit your specific needs. Whether you’re a student, teacher, business owner, content creator, or scientist, Mindomo can help you create the right diagram for your project.
Plus, you can easily collaborate with others and share your diagrams securely.
In a world that increasingly relies on complex data and structures, visual diagrams can help. They’re an essential tool for anyone looking to analyze and understand information.
So why not try out Mindomo and see for yourself how visual diagrams can improve your work and productivity? Sign up today and start creating diagrams.
Keep it smart, simple, and creative!
The Mindomo Team