T charts are a versatile and practical tool for organizing information visually and comparing and contrasting ideas. They can be used by students, teachers, and professionals alike.
These simple yet effective charts help to break down complex concepts, making them more accessible and easier to understand.
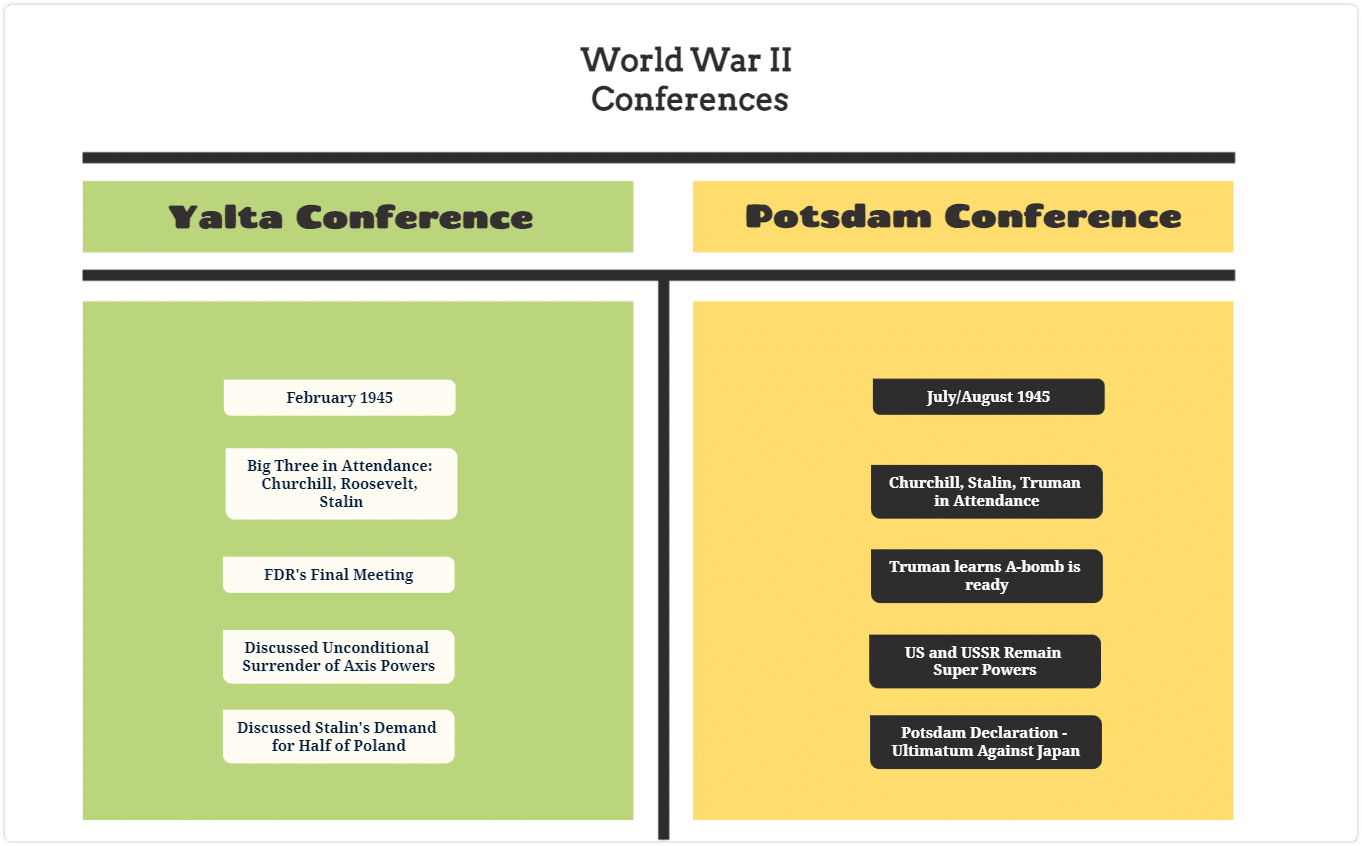
For example, students can use T charts to compare historical events. Or to analyze the similarities and differences between two literary characters. Or to weigh the pros and cons of various career paths.
A teacher can utilize T charts to plan lessons and teach. Or evaluate student performance. Or compare teaching methodologies.
Meanwhile, professionals can employ T charts for decision-making, project management, or analyzing the strengths and weaknesses of competing products or services. With countless applications across various fields, T charts have proven to be an invaluable tool for organizing and presenting information in a clear, concise manner.
In this comprehensive guide, we will discuss what a T chart is, when to use it, who should use it, and how to create one using Mindomo‘s powerful features.
What is a T Chart?
A T chart is a simple graphic organizer that separates information into two columns, making it easier to examine and compare two topics. It’s a visual representation of two big ideas.
Its name comes from its shape, resembling the letter ‘T’. The left side of the chart typically displays one aspect, while the right side presents the opposite or contrasting aspect.
T charts can be used for analyzing and evaluating various subjects.
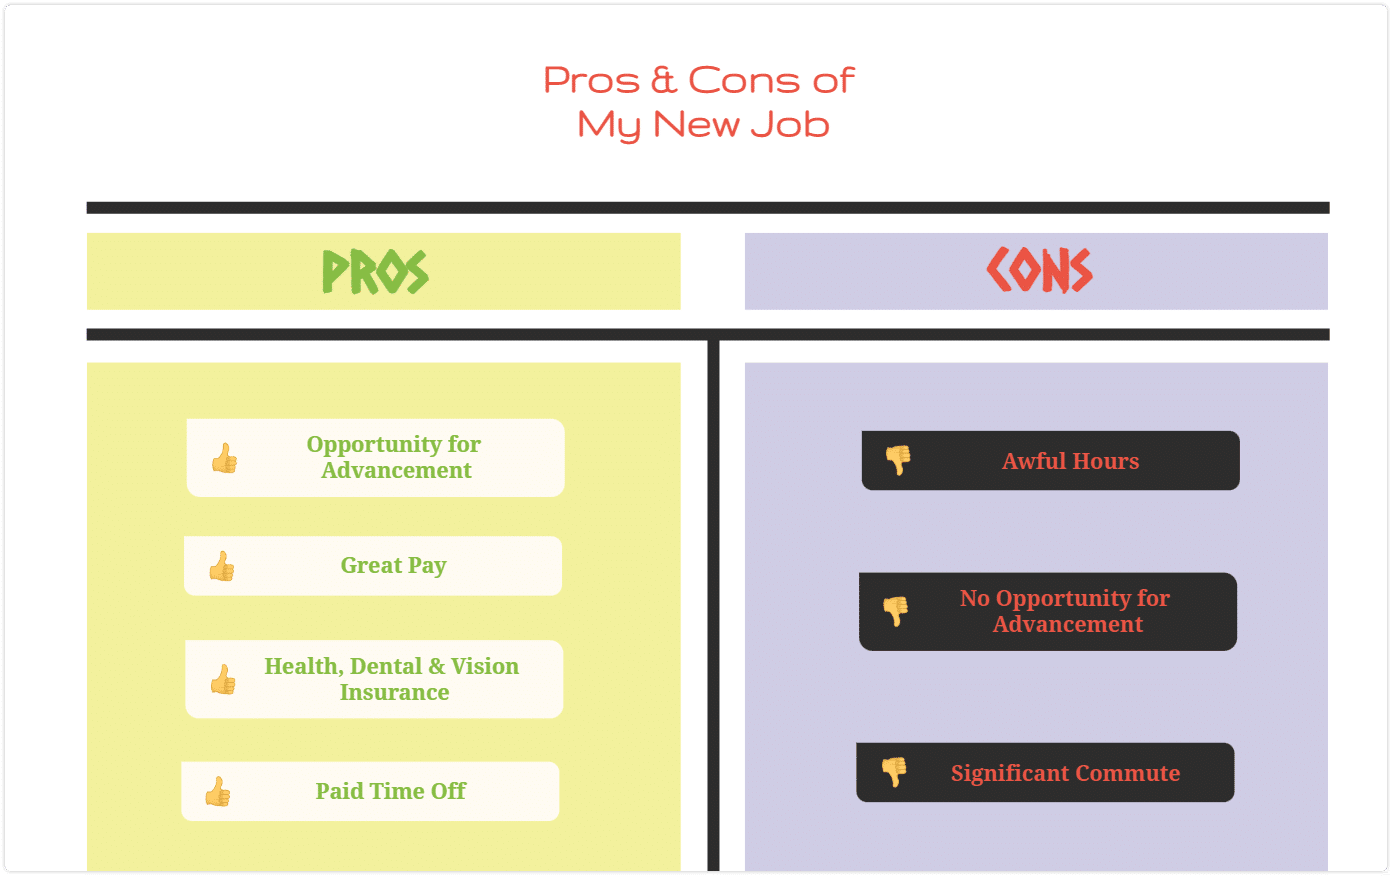
It can compare the advantages and disadvantages of a new job. Or it can be a helpful tool to evaluate the strengths and weaknesses of two political candidates. Or it can be used in a wide variety of other ways. There are a nearly limitless number of T chart examples to discover.
What is a T chart used for?
T charts are a great tool to use when you need to compare and contrast two or more items, ideas, or concepts. They can help you:
- Determine the advantages and disadvantages of a big decision.
- Compare and contrast the characteristics of two book characters.
- Evaluate the difference between political candidates.
- Examine the similarities and differences between the two concepts in a classroom setting.
- Draw conclusions about a subject or topic based on evidence.
Who Should Use a T Chart?
T charts can be used by anyone who needs to organize information and compare different aspects of a subject. They are especially helpful for:
- Students: T charts can help students analyze and compare the information. This makes it easier for them to understand complex concepts and improve their critical thinking skills.
- Teachers: T charts are an excellent teaching tool, as they can be used to present information visually. This encourages students to engage with the material actively.
- Professionals: T charts can be utilized to evaluate options, make informed decisions, and present data clearly and concisely.
Limitations of T Charts
While T charts are a helpful tool for organizing and comparing information, they do have some limitations:
- Comparing Complex Subjects: T charts may not be the best choice for comparing highly complex or multi-faceted subjects, as the two-column format can be restrictive. In that case, you may want to look for other options for graphic organizers.
- Oversimplification: In some cases, T charts may oversimplify complex subjects or ideas, leading to incomplete or superficial analysis.
How Do You Make a T Chart?
Mindomo offers a powerful platform for creating effective T charts. With its readily available templates and intuitive features, you can easily customize your T chart to suit your specific needs. Here’s how to create a T chart using Mindomo:
- Sign up for a free account on Mindomo and log in.
- Click on “Create” and search for “T Chart” in the list of templates.
- Customize your T chart by adding text, images, and colors to the left and right columns.
- Save your T chart to your account, Google Drive, or export it as an image or PDF. Then, you can share your t chart graphic organizer with others.
You can also create it from scratch, adding a background you can make or search on the web and then only add topics in the right place of the table and customize them.
Why Use Mindomo for T Charts?
A graphic organizer like Mindomo offers several advantages for creating T charts, including:
- Customization: You can easily customize the appearance of your T chart, including the color scheme, font, and layout. This makes it easy to contrast ideas or show the differences between facts vs opinions. And since there’s a readily available template on Mindomo, getting started is a snap.
- Collaboration: Mindomo allows you to collaborate with others in real time. This makes it easy to share your T chart and gather input from multiple sources. It’s a way to make team communication effortless and easy.
- Integration: With Mindomo, you can save your T chart directly to your Google Drive or export it as an image, PDF, and more export formats. This makes it possible to share your t chart in whatever desirable format you want.
Tips for Effective T Chart Use
To make the most of T charts, consider the following tips:
- Keep it concise: Focus on the most important points and avoid overcrowding the chart with excessive information.
- Be specific: Use clear and precise language to convey your ideas effectively.
- Organize information logically: Arrange your points in a logical order to make it easier for your audience to understand and follow your comparison.
- Use visuals: Including images, icons, or different colors can make your T chart more engaging and easier to comprehend.
- Revise and refine: Review your T chart to ensure all relevant information is included, and make any necessary revisions to improve clarity and readability.
T Chart Examples for Various Situations
T charts can be applied to a wide range of situations. Here’s an example or two:
- Class Field Trip: Teachers can use a T chart to compare two potential field trip destinations. This could help students make the best decision based on factors such as cost, distance, and educational value.
- Book Characters: Students can use a T chart to compare the traits, motivations, and actions of two characters from a story. This would then enable them to better understand the characters’ roles and relationships within the story.
- Special Education: T charts can serve as a valuable tool in special education settings. They’re particularly valuable since they provide a clear visual of information that can be particularly helpful for students with learning difficulties.
A Few Concluding Thoughts
T charts are an incredibly versatile and useful tool for organizing and comparing information across various contexts.
Mindomo’s powerful features make it easy to create effective and visually appealing T charts. This kind of diagramming tool can enhance critical thinking, decision-making, and communication skills.
By understanding the best practices and limitations of T charts, you can maximize their potential. This empowers you to use them to make more informed choices in your personal, academic, or professional life.
So, go ahead and explore the world of T charts with diagramming software like Mindomo. It’s your key to unlocking the power of visual organization and comparison. Sign up today!
Keep it smart, simple, and creative!
The Mindomo Team