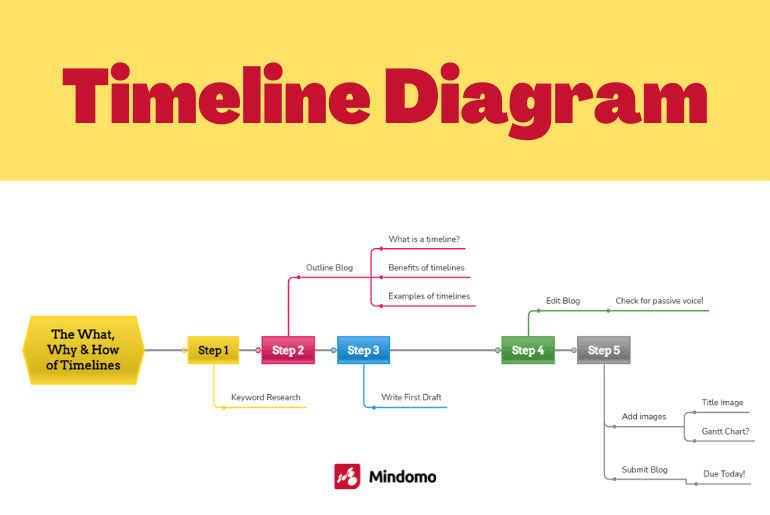
Depending on your goals, timeline diagrams can be one of the most effective ways to organize your data. They’re great for visualizing objectives and tracking progress, whether for business or your personal life. They can be an essential tool for creating business plans and project management. And there are a few better ways to examine cause-and-effect relationships. That’s why they’re so popular for visualizing historical events.
By putting things on a timeline, you can see the whole and the parts at a glance. You can quickly understand how each piece is related to those around it. And perhaps best of all, you can identify potential roadblocks and plan for them in advance.
So, let’s dive right into the what, why, and how of timeline diagrams.
What is a timeline diagram?
Want to understand timelines?
At their most basic, timeline diagrams are a visual way to represent information over a period of time. Most timelines feature an actual line divided up into project milestones or units of time, whether hours, days, etc. A sequence of events or steps is then labeled in chronological order along the line. Timelines bring order and conciseness to complex information, especially if time or sequence is involved.
Timelines can depict the progression of a project or show the development of a person or place over time. They can reveal relationships between events that may not be immediately apparent. And they can help you identify patterns and trends.
In addition, timeline diagrams can be customized to fit your specific needs. For instance, you can choose to display information by step, year, day, or any other measurement of time. And with the right timeline maker, you can even add visual aids, files, and links right directly to your timeline outline.
Ultimately, timelines offer a flexible and powerful way to visualize information over time, making it easy to understand.
Examples of timeline diagrams in action
Timeline diagrams aren’t just phenomenal tools in theory. They’re incredibly practical.
The best way to understand timelines is to think about how they’re used in real-world situations. Here are a handful of examples:
- Understand the sequence of events in a complex process, such as data analysis or product development.
- Plan and manage events, such as a wedding or corporate events.
- Track progress over time, from the construction of a building to the launch of a social media platform.
- Visualize the sequence of events in history, such as the American Revolution or the rise of the Roman Empire.
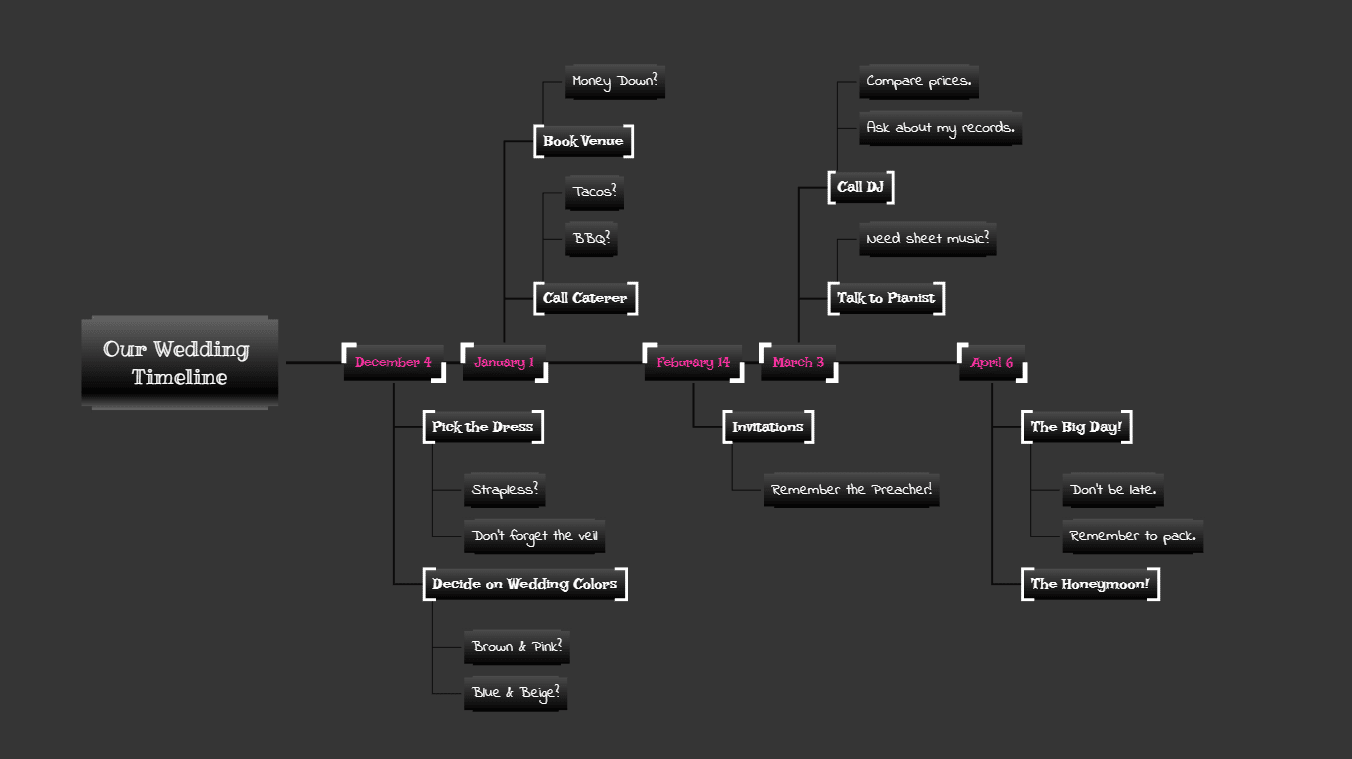
Timeline diagrams & project management
Talk of timelines may bring you back to your high school history class and its list of historical events (maybe you have in mind a history mind map). But timelines are one of the most popular project management tools out there. They allow project managers to track the progress of a project and ensure that it stays on schedule.
Timeline diagrams typically consist of a series of project milestones laid out in chronological order. These are the key project objectives that need to be achieved for the project to succeed. By tracking their progress, project managers can identify potential issues and address them ASAP.
Additionally, timeline diagrams can be used to communicate project timelines to project stakeholders. Ultimately, timeline diagrams are a valuable project management tool that ensures projects are completed on time and within budget.
Project management & Gantt charts
Gantt charts are a type of timeline that shows the progress of a project over a period of time. The horizontal axis of the graph represents the timeline of the project. The vertical bars show the different tasks that need to be completed. The lengths of the bars represent the amount of time that each task will take to complete.
Gantt chart software is often used when fleshing out business plans. After all, they provide a clear visual representation of the whole project’s timeline and tasks. They can also be used to identify potential bottlenecks or problems with the project schedule.
3 benefits of timelines
Timeline diagrams aren’t just for major corporations. You can use a timeline to plan and track your progress for personal projects as well. Whether you’re planning a product launch or an herb garden, timelines can be a huge help. Here are four reasons why.
1. Timeline diagrams help you visualize goals and track progress
A timeline diagram can help you visualize your goals and track your progress. By breaking down your goal into smaller steps, you can quickly take in your whole project timeline. This can be a great motivator, as it can help you see your progress and give you a better sense of how close you are to achieving your goal.
2. Timeline diagrams identify potential roadblocks and help you plan
By mapping out what’s to come, timelines help you identify potential roadblocks and plan for them in advance. For example, if you know a key component is going to be delayed, you can make other arrangements. By regularly checking your progress by your timeline, you can ensure that deadlines are met.
3. Timeline diagrams can be customized to fit your needs
There are dozens of ways to create a visually appealing timeline. You can use old fashioned paper and a pen. Or a whiteboard. Or general-purpose software like Microsoft Office. Or you can take advantage of a mind map tool like Mindomo.
Mindomo allows you to create a timeline and customize it to fit your specific requirements. For example, you can use any measure of time you want, from seconds to years or anything in between. You can add visual aids. You can create horizontal or vertical timelines. And you can even leverage dozens of free timeline templates.
How to create a timeline diagram
Once you’ve chosen your timeline maker software or diagramming tool, creating a visually appealing timeline is simple. Depending on what you use, you may even be able to simplify the process further by using free timeline templates. So, what’s the best way to create your timeline?
- Determine the best kind of timeline to use. Depending on what you’re charting, you may want to go with a Gantt chart, a vertical timeline, or something else. You may also want to browse any available templates. A simple timeline template can drastically reduce the amount of time you spend creating your timeline.
Tip: Mindomo allows you to convert any timeline into a Gantt chart instantly (or vice-versa). Feel free to start creating a timeline from scratch ad then turn it into a Gantt chart if you need to do it.
- Identify the start and end points of the timeline. This will give you a sense of the overall scope of the project. It will also allow you to determine the overall structure, including the best measurement to use.
- Next, determine the major milestones or events that need to be included in the timeline. These could be major deadlines, key decisions, or other significant moments. Situate them on the timeline where they belong.
- Once you have the major milestones identified, you can begin to map out the rest of the timeline. As you go, add whatever details you need. Attach links, images, documents, graphs, or other files. This will help to make the timeline more informative and easier to understand.
Tips for using timeline diagrams effectively
Before you start creating your first timeline, you should keep a few things in mind.
First, it is important to use a consistent scale. This will make it easier to compare different events or track changes over time.
Second, use labels and annotations sparingly. Too much information can make a timeline diagram confusing and difficult to read.
Finally, remember that timelines are meant to be a summary of information; they should not be overloaded with details.
By following these tips, you can create an effective timeline diagram that will help you to better understand complex information. And if you use a simple timeline template, you can get it done even quicker and more easily.
Sign up on Mindomo and start creating your timelines!
Keep it smart, simple, and creative!
The Mindomo Team


