This template enables you to plot and analyze information along a single axis, making it ideal for displaying trends, changes over time, or single-variable data. Enter your data points along the axis to create a clear and straightforward chart. Perfect for simple reports, presentations, and quick data reviews, this template helps you present and interpret single-dimensional information effectively. Does your chart start at a particular event? Add a title for this event, or delete this topic if it is not needed. Items or ideas are positioned along the axis. For example, they might be events in a sequence or on a timeline. Add a legend for the left/right direction in your chart. For example, it might represent time after an event, or steps in a sequence. 思维导图可以帮助你集思广益,建立概念之间的关系,组织和产生想法。 然而,思维导图模板提供了一种更容易上手的方法,因为它们是包含特定主题信息和指导说明的框架。从本质上讲,思维导图模板确保了将特定主题的所有元素结合在一起的结构,并可作为个人思维导图的起点。思维导图模板是一种资源,可为创建特定主题的思维导图提供实用的解决方案,无论是用于商业还是教育。 Mindomo 为你带来智能思维导图模板,让你毫不费力地运作和思考。 您可以从Mindomo的商业或教育账户中选择各种思维导图模板,也可以从头开始创建自己的思维导图模板。任何思维导图都可以转化为思维导图模板,只需在其中一个主题上添加进一步的指导说明即可。Single axis chart (blank timeline)
A chart with a left/right axis is useful for drawing timelines or events in sequence.
The position of items along the line indicates their order.
Keywords: timeline, events planning, events in sequence, Planning & Organizing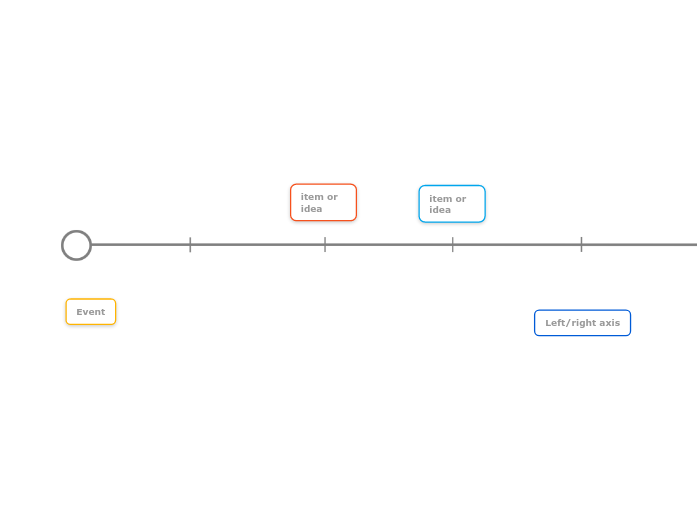
1 Axis Chart Template
Event
item or idea
Double-click to add a new topic to the map.Left/right axis
为什么使用 Mindomo 思维导图模板?
模板具有各种功能:

")

")