
Why use a Gantt Chart Maker?
A Gantt chart maker makes project planning easier by giving you a clear structure to follow. Tasks, deadlines, and dependencies are all laid out in one visual timeline, so it’s simple to see what needs to be done and when. With everything organized in one place, it’s easier to stay on track, manage teams, and adapt to changes as your project evolves.
Mindomo allows you to easily create professional-looking Gantt charts, even if you’re a beginner. You can get started in minutes using a ready-made template where you only need to add your tasks, and the chart builds itself. We’ll walk you through how it works step by step in this guide. And if you’re still exploring options, don’t miss our comparison of the top 5 best Gantt chart makers of 2026.
What is a Gantt chart and what is its purpose?
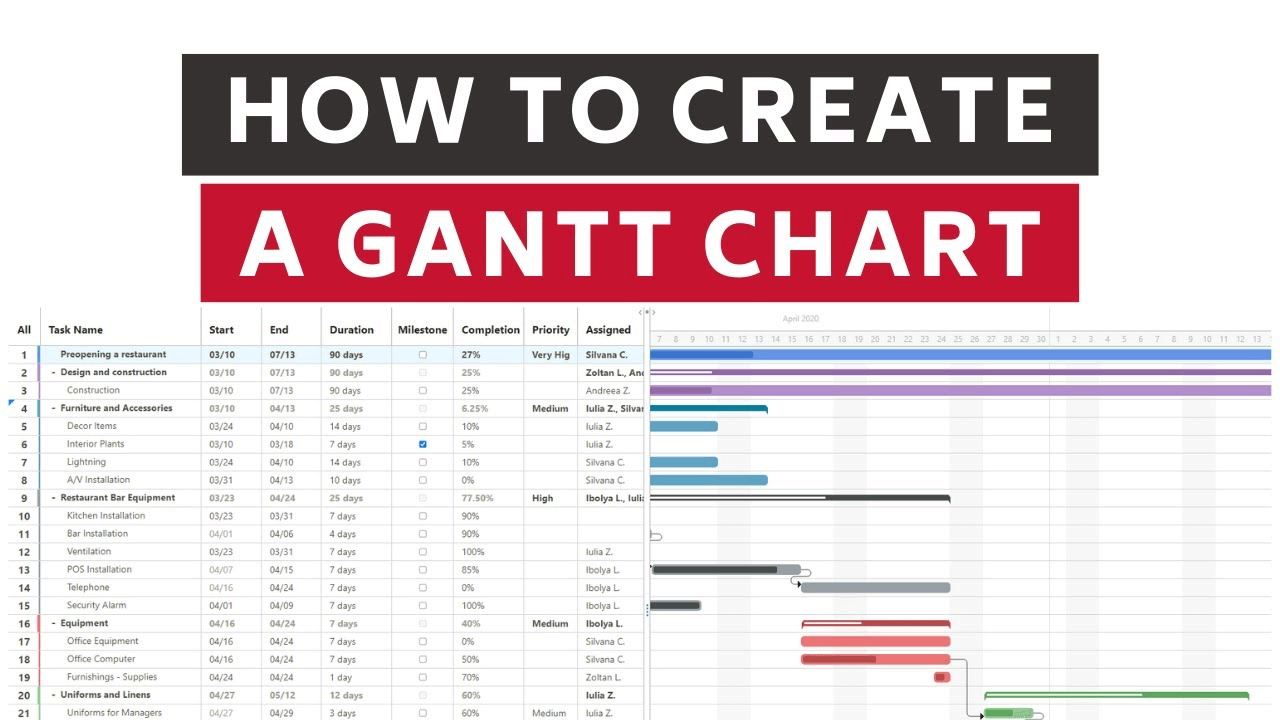
A Gantt chart is a project management tool used to plan, schedule, and track project tasks. Its main components are:
- a vertical list of activities involved in the project that can be found on the chart’s left side;
- a horizontal timeline showing the days, weeks, or months of the project that can be found on top of the chart;
- on the right side of the chart, below the timeline, horizontal markers for each task (its duration, start and end dates);
- dependencies showing a certain order in which tasks will be completed;
- assignees responsible for completing each task;
- milestone, completion, and priority details.

How to create a Gantt chart step-by-step?
A simple Gantt chart can provide a broad overview of multiple projects thanks to its visual bar chart representation of project timelines. As opposed to MS Project, which might feel too rigid, Mindomo is an easy-to-use online collaboration tool that also enables the creation of Gantt charts.
Follow the next step-by-step guide and learn how to do it. Start by logging in from the website. Go to “Create” from your dashboard, and choose the Gantt framework:

A new spreadsheet, both textual and visual, will appear and you can start planning your project from scratch:

1. Create tasks


The task management is very simple: the main tasks will act as a summary. You can expand them to view the subtasks by clicking “+” next to it. When you click on “-” it will show only the main task.


2. Set start and end dates for each task
The third and fourth columns in the chart contain the start and end dates. You can select them using the calendar icon that appears when you click inside the cell.
However, you can also go to the next column which is called “Duration” and set the number of days for the activities. Once you do this, the taskbars from the right side of the chart will be modified automatically according to the period of time selected.

3. Add notes to your tasks
The management tool allows you to add a note to every task. Click the task number and a text box will appear on your screen. The notes are a perfect place to write extra information - suggestions, quick ideas, questions, etc.
You can be creative and add pictures or videos as note attachments. It can help your team understand the tasks better.

4. Add dependencies to improve your workflow
Once you set the tasks, it’s time to establish the connections between them. How completing a task influences the beginning of another activity.
Hover over a task, then click on the black dot next to it (left/right). Then drag it and link it to the one you want to connect. An arrow connecting the two tasks will appear, making it more obvious which task is the predecessor and which is the successor.


5. See major dates or deliverables at a glance
From the “Milestones” column, check off the tasks that are key markers for project success. Once checked off, the taskbar will be automatically modified into a diamond, making the project’s roadmap more straightforward.
Consequently, your graphic will look like this:


6. Update the progress of your tasks
Manually add progress percentages for tasks. When you edit the completion percentage of a subtask, the tool automatically calculates the completion of the main task.
The main task’s completion bar will update depending on the overall progress. Updates are visible inside the blue rectangle, completed tasks and subtasks are represented with white, while the darker shade of blue shows the extent of tasks and subtasks that still need completion.


7. Set task priority levels

8. Assign tasks

9. Connect live with your team members
One of Mindomo’s best features is that everything you change in the chart is instantly shared with your team. These real-time changes will improve collaboration and productivity.
Whenever a team member joins the chart, you are notified in the bottom right corner of the screen. Use the built-in chat to engage real-time with your colleagues and facilitate meaningful decision-making.

10. Turn diagrams into Gantt charts and vice-versa
With Mindomo, you can turn your Gantt file into a mind map (read more about what is a mind map) or an outline. To do that, go to the File Menu and choose one of the options:
➤ View as mind map
➤ View as outline

Having a versatile view mode will help you save precious time - you won’t need to constantly switch from a mind map creator to a Gantt charts program.
Check out our Gantt chart help page for more guidance and the following video for more details, tips and tricks to create Gantt charts with ease:
When to use a Gantt diagram?
Do you know why Gantt charts are often a more accessible option than project management software? Because they provide an easy-to-read interpretation of planned activity against a certain time frame.
Use a Gantt chart to get a time-centric, resource-driven insight into your project’s progress:
- At a glance, all tasks and subtasks appear in relation to their assignees;
- You know the duration of each task, all task dependencies, and the total amount of time needed to finish the entire project. So, adjusting schedules if any delays occur will be easier.
- You can keep an eye on the progress and celebrate each milestone at a time.
The critical path will become clear - what needs to be done and by when so that the project’s overarching goals are reached.
No matter the industry, as long as you handle a time-bound project, using Gantt files will make a difference.
Software developers can plot all software development life cycle phases (planning, design, development, testing, deployment, and maintenance) to deliver quality products on time.
Educators can use this tool for curriculum planning, research planning, internship worksheets, and assessment tasks while keeping a calendar view of summer vacations and holidays.
Marketers can map out all the steps of their campaign (audience research, intended strategy, content type and format, content promotion, and engagement evaluation) against the campaign’s time frame.
Event planners can use Gantt file frameworks to successfully bring together clients and partners on the roadmap of their events.
In manufacturing, a Gantt tool can help with planning, implementing, and monitoring production processes.
In construction, this chart will enclose all major phases of a construction project, time-bound, so that the people involved can refer to - engineers, architects, subcontractors, service providers, clients, etc.
Key Benefits of Using Mindomo's Gantt Charts for Project Planning
Break projects in tasks and subtasks

Switch views of your project
A huge advantage of using Mindomo is that you can make a Gantt chart starting from a mind map (learn more about how to make a mind map). Compared to a regular chart maker like MS Project, Mindomo lets you create many graphic representations.
Start by brainstorming to gather information, then create a mind map diagram, and with just one click, turn the diagram into a Gantt chart.
A Gantt chart in Excel is just a table, while Mindomo includes various visual representations: mind maps, concept maps, and outlines. Turn any of them into Gantt files and vice versa.
For example, there are many mind maps for business that you can use as a starting point in your business projects.
Moreover, you can use Mindomo to create even more types of visual diagrams, such as kanban boards, fishbone diagrams, logic charts, timelines, organigrams, etc.

Set deadlines & task dependencies
You have multiple options to schedule tasks using Mindomo:
◼ add a start date and an end date for each task;
◼ add a start date and the duration to each task;
◼ add dependencies between tasks;
Task dependencies will show how tasks overlap and relate to one another. Some task executions rely on completing previous tasks, while others are independent and can be carried out simultaneously. Visualizing and understanding these dependencies is critical for project success.

All information is right where you need it
On the right side, you have a visual representation of your ongoing roject.

Work offline on Gantt charts
Mindomo lets you work offline using both the Desktop app and the browser version. Mindomo has also a local-only desktop mode, which offers extra security, being ideal for companies that prefer not to use cloud storage.
In the browser, you can continue editing without an internet connection, and changes will sync automatically once you’re back online. Mindomo gives you all the flexibility you need for planning, implementing, and monitoring projects.
Collaborate with your team in real time
Managing a project toward success requires team cooperation at all times. Gantt charts can significantly help, and Mindomo allows you to create them as shareable and collaborative tools. As you collaborate on tasks, your project plan updates automatically and in real-time for everyone.
-
Collaborate in real time with automatic updates for all team members
-
Use the built-in chat to discuss tasks directly inside your Gantt chart
-
Stay informed with email notifications for comments, changes, and task completions
-
Assign tasks, set milestones, and manage responsibilities with ease
Mindomo Gantt chart features
◼ Set a schedule: add task due dates for better time tracking. Use the calendar and the “Duration” column will be automatically updated.
◼ Automatic project scheduling: unlike a Gantt file in Excel, Mindomo offers a visual representation of task bars that are automatically updated if you set new start and end dates.
◼ Set milestones: consider them as signposts that keep things on track. You will see them as diamond-shaped checkpoints marking when activities have been completed or a new phase is launched.
◼ Connecting tasks: identifying task dependencies will help you streamline task execution, and ensure a well-maintained project schedule.
◼ Assign tasks: distribute the tasks. Being an efficient project planning software, Mindomo allows you to assign every task to one or more team members.
◼ Change view mode: create a Gantt chart starting from a mind map, concept map, or outline. Convert any of these into another. Make the most out of the structure flexibility.
◼ Collaborate real-time: work together with your team and see all updates instantly.
◼ Discuss live: save precious time by using the built-in chat room.
◼ Add comments: keep all meaningful explanations in one place, right where you need them.
◼ Attach files: upload multimedia files on the comment panel from your computer, Google Drive, Dropbox, or OneDrive. Add any piece of information that helps.
◼ Email notifications: benefit from email notifications that keep you up-to-date with everything. Enable them for any task updates, new comments, or task progress.
◼ Online-offline synchronization: unlike regular online Gantt chart software, Mindomo can be used offline, and with one click you can sync all your work. Save precious time and be productive anytime.
◼ Export options: you can export your Gantt file in mind map formats, Microsoft Excel formats, or multiple other formats like PDF, DOCX, TXT, OPML, MXP, or XML.
For more information about Mindomo’s tool, check out our Gantt chart software page.