This template enables you to plot and analyze information along a single axis, making it ideal for displaying trends, changes over time, or single-variable data. Enter your data points along the axis to create a clear and straightforward chart. Perfect for simple reports, presentations, and quick data reviews, this template helps you present and interpret single-dimensional information effectively. Does your chart start at a particular event? Add a title for this event, or delete this topic if it is not needed. Items or ideas are positioned along the axis. For example, they might be events in a sequence or on a timeline. Add a legend for the left/right direction in your chart. For example, it might represent time after an event, or steps in a sequence. マインドマップは、ブレインストーミング、概念間の関係の確立、アイデアの整理と生成に役立つ。 しかし、マインドマップのテンプレートは、特定のテーマに関する情報を含むフレームワークであり、ガイドとなる指示が含まれているため、より簡単に始めることができます。要するに、マインドマップのテンプレートは、特定のテーマのすべての要素を組み合わせた構造を確保し、あなたの個人的なマインドマップの出発点として機能します。ビジネスでも教育でも、特定のトピックに関するマインドマップを作成するための実用的なソリューションを提供するリソースです。 Mindomoは、スマートなマインドマップのテンプレートを提供します。 マインドマップのテンプレートは、Mindomoのビジネスアカウントや教育アカウントから選ぶこともできますし、ゼロから独自のマインドマップテンプレートを作成することもできます。どのマインドマップも、トピックの1つにさらにガイドノートを追加することで、マインドマップテンプレートマップに変換することができます。Single axis chart (blank timeline)
A chart with a left/right axis is useful for drawing timelines or events in sequence.
The position of items along the line indicates their order.
Keywords: timeline, events planning, events in sequence, Planning & Organizing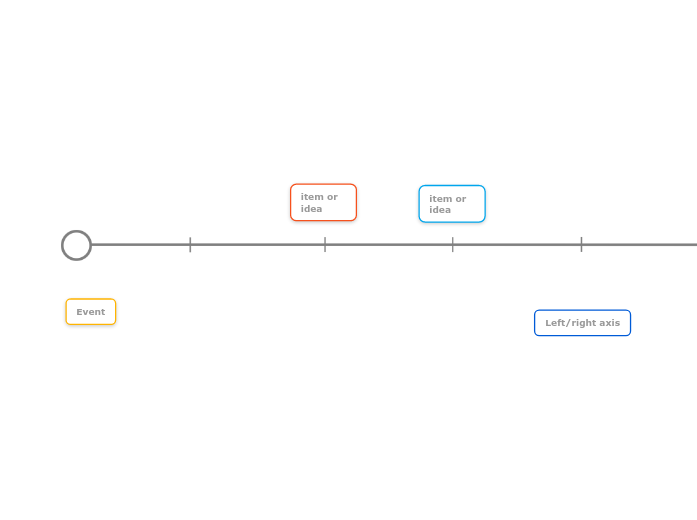
1 Axis Chart Template
Event
item or idea
Double-click to add a new topic to the map.Left/right axis
なぜMindomoのマインドマップテンプレートを使うのか?
テンプレートにはさまざまな機能がある:
")

")
