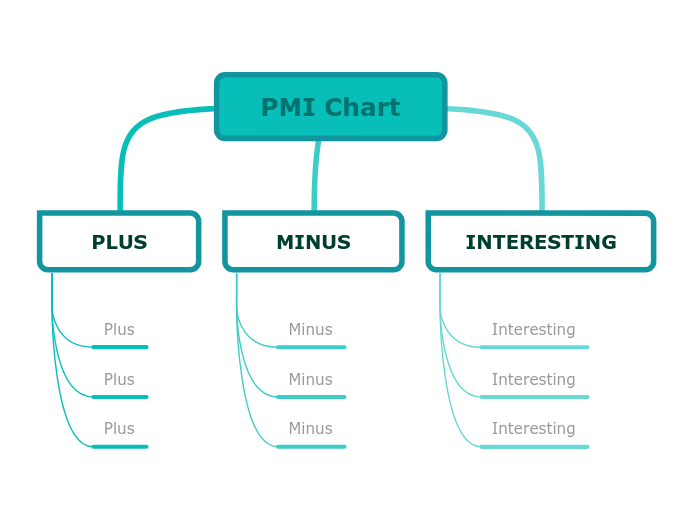
PMI charts will help you to organize your thoughts about making a decision, evaluating the pros and cons of a debate topic. PMI charts were formalized by Edward de Bono in 1992. PMI charts are graphic organizers for your thoughts when you are trying to make a decision. Use this PMI chart template to evaluate the advantages and disadvantages of a topic. Also, add the interesting things or complications that come along with your topic. The letters in PMI stand for the three sections of the PMI chart: Plusses, Minuses, and Interesting things. The I can also stand for Implications on some topics. Add the interesting things or implications that come along with your topic. Add the drawbacks of your topic. Add the advantages of your topic. Miellekarttojen avulla voit ideoida, hahmottaa käsitteiden välisiä suhteita sekä järjestää ja tuottaa ideoita. Miellekarttamallien avulla alkuun pääsee kuitenkin helpommin: ne ovat valmiita runkoja, jotka sisältävät tietoa tietystä aiheesta sekä ohjeita kartan täydentämiseen. Malli antaa rakenteen, joka kokoaa yhteen aiheen kaikki osa-alueet ja toimii lähtökohtana omalle miellekartallesi. Se on käytännöllinen tapa luoda miellekartta tietystä aiheesta niin työelämän kuin opiskelun tarpeisiin. Mindomon älykkäiden miellekarttamallien avulla ajattelet ja toimit vaivattomasti. Voit valita erilaisia miellekarttamalleja Mindomon yritys- ja koulutustileiltä tai luoda omia malleja tyhjästä. Minkä tahansa miellekartan voi muuttaa malliksi lisäämällä sen aiheisiin ohjaavia muistiinpanoja.PMI chart template
Tietoja tästä mallista
PMI chart template
PMI Chart
Type in your topic.INTERESTING
Interesting
MINUS
Minus
PLUS
Plus
Miksi käyttää Mindomon miellekarttamallia?
Malleissa on useita toimintoja:
-
Tuotteet
-
Käyttötarkoitukset
- Yleiset käyttötarkoitukset
- Miellekartat koulutukseen
- Miellekartat liiketoimintaan
- Miellekartat henkilökohtaiseen kehitykseen
- Apuvälineteknologia
- Tiimiyhteistyö
- Kampanjabriefit markkinoijille
- Asiakastarpeiden kartoitustyöpajat konsulteille
- Perehdytyspolut HR:lle ja L&D:lle
- Tietämyksenhallinta
- Tiimin osaamismatriisi
- Projektikirjasto
- Roolit
- Markkinoijat
- HR ja L&D
- Konsultit
- Projektinhallinta
- Markkinointikampanjan suunnittelu
- Henkilöstökoulutusten jalkautus
- Työn laajuuden määrittely
- Ideoiden organisointi
- Ongelmapuut
- Koulutustarveanalyysi
- Miellekarttojen hyödyt
-
Ratkaisut
- Oppaat
- Tee esityksiä miellekartoilla
- Opi miellekartoilla
- Suunnittele ja järjestä miellekartoilla
- Priorisoi tehtäviä miellekartoilla
- Tee muistiinpanoja miellekartoilla
- Aitoja asiakastarinoita
- Koulutussisällön skaalaaminen 11 000 lääkärille
- Tiimin työnkulku: kokeilusta korvaamattomaksi kahdessa kuukaudessa
- 10 vuotta ilman dioja: arkkitehtuuriluennot uusiksi
- Lue kaikki tarinat
-
Resurssit
- Perusteet
- Mikä on miellekartta?
- Miten miellekartta tehdään?
- Mikä on käsitekartta?
- Miellekarttaideoita opiskeluun
- Oppaat ja tuki
- Video-oppaat
- Ohjekeskus
- Foorumi
- Esimerkit ja mallit
- 100 miellekarttaideaa
- Miellekartat apuvälineteknologiana
- 29 parasta miellekarttaesimerkkiä
- Ominaisuussivut
- Koulutus
- Opettajan tehtävät
- Työ ja vapaa-aika
- Työpöytäsovellus
- Mindomo-blogi
- Hinnoittelu
- Kirjaudu sisään
- Rekisteröidy
- Hallintapaneeli
Yleiset käyttötarkoitukset
Miellekarttojen hyödyt
Miksi visuaalinen ajattelu helpottaa muistamista ja suunnittelua.
Perusteet
Oppaat ja tuki
Esimerkit ja mallit
Ominaisuussivut
 Blogi
Mindomo-blogi
Oppaita, esimerkkejä ja tutkimusta visuaalisesta ajattelusta.
Selaa kaikkia artikkeleita