
We are thrilled to announce a significant enhancement to our platform that opens up a world of new possibilities for your visual thinking needs. As part of our commitment to empowering your diagramming experience, we’re introducing a feature that many of you have eagerly awaited: the Fishbone Diagram Layout!
What’s new?
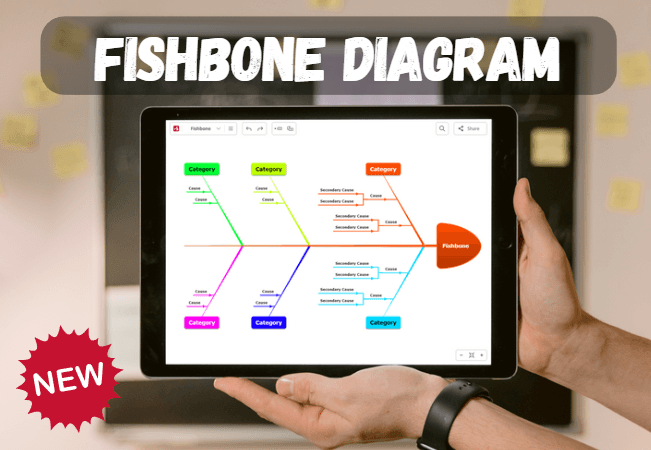
Up until now, Mindomo offered a selection of Fishbone Diagram templates to help you analyze causes and effects in a structured way. Now, you can create Fishbone Diagrams from scratch or transform existing diagrams into Fishbone structures with ease.
Why Fishbone Diagrams?
Fishbone Diagrams, also known as Ishikawa or Cause-and-Effect Diagrams, are a powerful tool for root cause analysis, brainstorming, project management, and quality improvement. They help you explore the factors contributing to a particular issue, making complex problems more manageable and solutions clearer.
How to use the new Fishbone Diagrams layout?
Creating a Fishbone Diagram from scratch:
- Log in to your Mindomo account;
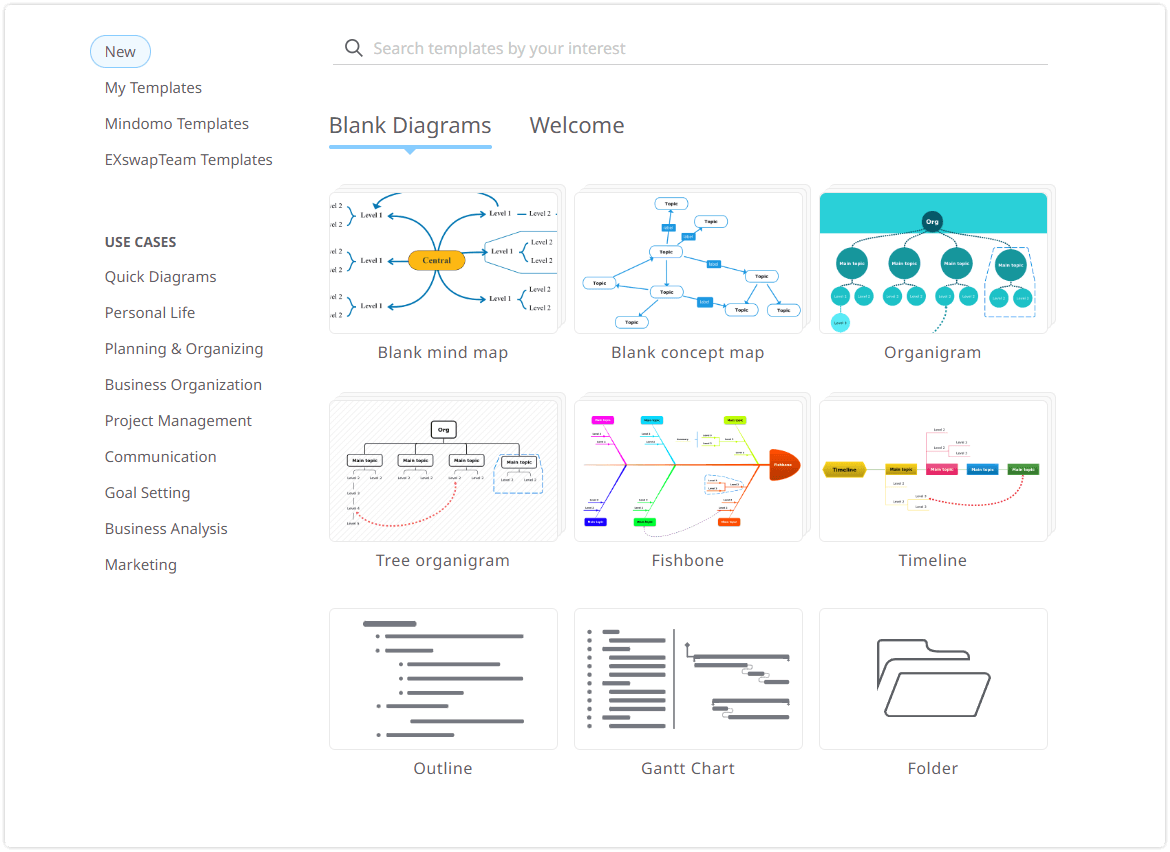
- On your Dashboard, click on the “Create”;
- Select the “Fishbone Diagram” layout;
- Begin adding and connecting your ideas in the Fishbone structure.
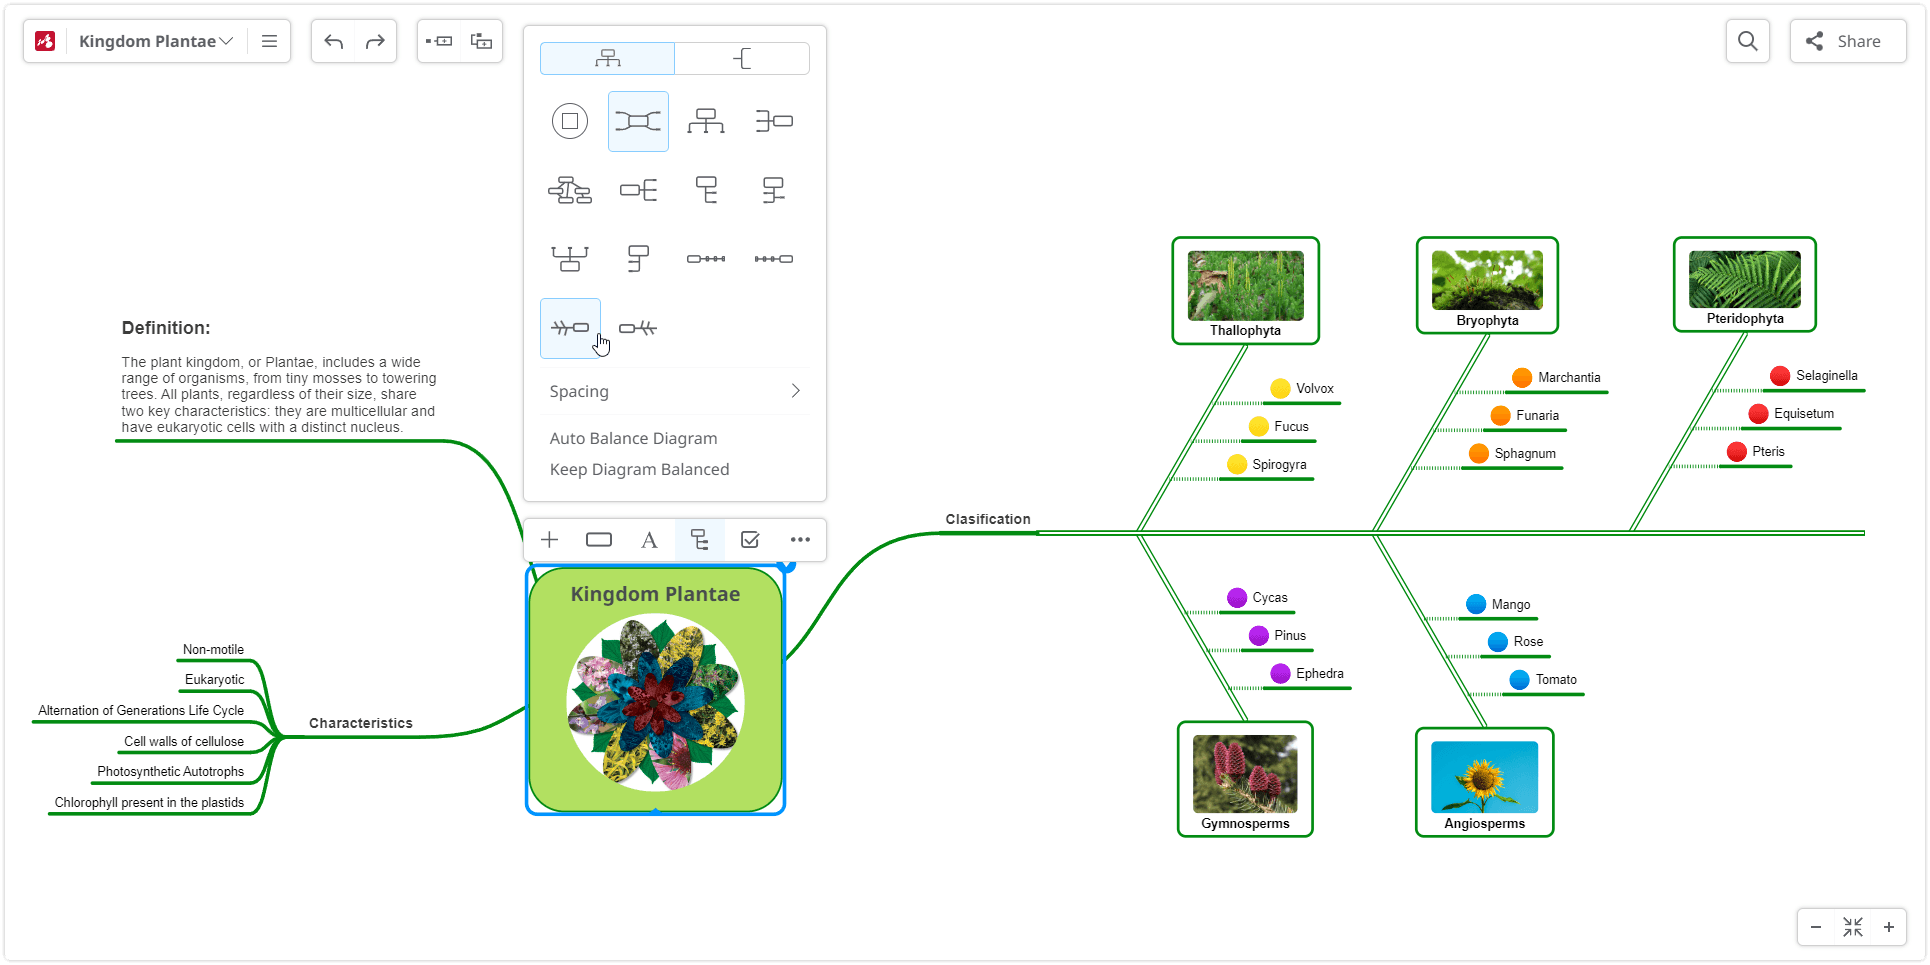
Converting an Existing Diagram to Fishbone:
- Open an existing diagram;
- Click on the Context Menu, click on the Topic Connections menu;
- Select Fishbone layout.
Experience the New Possibilities
We believe that this update will take your brainstorming and problem-solving to the next level. Whether you’re a student, teacher, business professional, or simply someone with a curious mind, our Fishbone Diagram Layout is designed to support your visual thinking journey.
As always, your feedback is invaluable to us. Please feel free to share your thoughts, suggestions, and experiences in our forum. We’re here to support you every step of the way.
Thank you for being a part of the Mindomo community. Together, we’ll continue to unleash the power of visual thinking.
Keep it smart, simple, and creative!
Silvana
The Mindomo Team