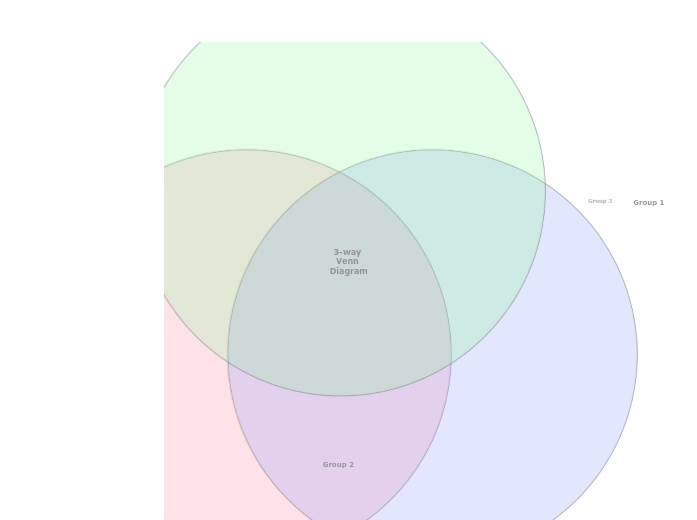
Explore the relationships between three different sets of data using the 3-Way Venn Diagram template. This template features three intersecting circles that allow you to compare and analyze data across multiple dimensions. Start by filling in each circle with your data sets and use the overlapping areas to identify commonalities and differences. This diagram helps you visualize how the sets interact, making it ideal for data analysis, problem-solving, and strategic planning. Perfect for presentations, reports, and collaborative projects, this template provides a clear and comprehensive view of complex relationships. Type in the name of the third group and press Enter. Type in the name of the second group and press Enter. Type in the name of the first group and press Enter. A Venn Diagram compares items by assigning them to groups. An item can belong to: The item counts (and not the areas of the circles and their overlap) indicate the population of each group or the overlap between groups. 心智圖能幫助您集思廣益、建立概念之間的關聯,並整理與激發想法。 而心智圖範本讓入門更容易,因為範本是已含特定主題資訊與引導說明的架構。換句話說,範本先替您搭好能涵蓋該主題所有要素的結構,可作為您個人心智圖的起點。無論用於商業或教育,心智圖範本都能為特定主題的心智圖提供實用的解決方案。 Mindomo 提供智慧心智圖範本,讓您輕鬆工作、順暢思考。 您可以從 Mindomo 商業版或教育版帳號中挑選各式心智圖範本,也可以從頭建立自己的範本。只要在主題上加入進一步的引導說明,任何心智圖都能變成心智圖範本。關於此範本
3 Way Venn Diagram template
Group 3
Double-click in the background to add items to this group, or in the overlaps between the groups.Group 2
Double-click in the background to add items to this group, or in the overlaps between the groups.Group 1
Double-click in the background to add items to this group, or in the overlaps between the groups.3-way Venn Diagram
為什麼要使用 Mindomo 心智圖範本?
範本提供多種功能: